


A retail lease is typically a 5-10 year commitment. The location you choose determines the ceiling on your store’s performance for the entire duration. No amount of operational excellence, marketing spend, or merchandising skill can overcome a fundamentally wrong location. Get it right and the store has a structural advantage from day one. Get it wrong and you spend years compensating for a decision that was made with incomplete information.
The difference between the retailers who consistently open successful stores and those who close them within three years is not luck. It is process. Specifically, it is the quality of the data that feeds the process and the rigour with which that data is analysed before capital is committed.
This guide covers the modern approach to retail site selection: what data you need, how to analyse it, and how to structure the decision process so that every new location is evaluated against objective criteria before anyone signs a lease.
Why most retail site selection goes wrong
The traditional site selection process relies heavily on broker relationships, personal visits, and gut instinct informed by experience. Experienced real estate teams develop strong intuition, and that intuition has value. But it also has blind spots.
The available-site bias. Teams evaluate sites that are available and presented by brokers rather than systematically identifying the best possible locations. The best location in a market may not be on the market, and the sites that are available may be available for a reason.
The single-visit bias. A site visit on a busy Saturday afternoon creates a different impression than the same site on a Tuesday morning. A single visit captures one snapshot of a location that varies by hour, day, season, and year. Foot traffic data replaces the snapshot with the full picture.
The comparison gap. Without data, it is difficult to compare candidate sites on a consistent basis. One site “feels” busier than another, but quantifying the difference and understanding why it exists requires measurement that anecdotal observation cannot provide.
The cannibalisation blind spot. Opening a new store too close to an existing one can erode traffic at both locations. This risk is invisible without trade area overlap analysis, and it is one of the most common causes of disappointing new-store performance.
Data does not replace experience. It complements it by filling the gaps where experience alone is insufficient. The real estate professionals who combine strong market intuition with rigorous data analysis consistently outperform those who rely on either one in isolation.
The data that drives site selection
Foot traffic data
Foot traffic is the most direct predictor of a retail location’s potential. Before a store opens, foot traffic data reveals how many people currently visit the candidate site and its surrounding area, when they visit, how long they stay, and how the location compares to similar sites.
Visit volume and trends. The baseline: how many people visit this location per week, per month? Is the trend growing, stable, or declining? A location where traffic has declined 15% over the past two years carries different risk than one that has grown 10%, even if the current weekly volume is similar. PassBy provides 5+ years of historical data across 1.5 million US store locations, giving you the trend context that a single observation cannot.
Temporal patterns. When does traffic peak? A location that peaks at lunchtime on weekdays serves a different retailer than one that peaks on Saturday afternoons. Understanding the hourly and daily pattern ensures that the location’s rhythm matches your store’s operating model.
Predictive forecasts. What is traffic likely to look like 90 days from now? PassBy’s predictive feeds, built on AI models developed with Stanford’s NeuralProphet team, project visit volumes forward. This allows real estate teams to factor seasonal and trend-based changes into their projections rather than assuming the current level will persist.
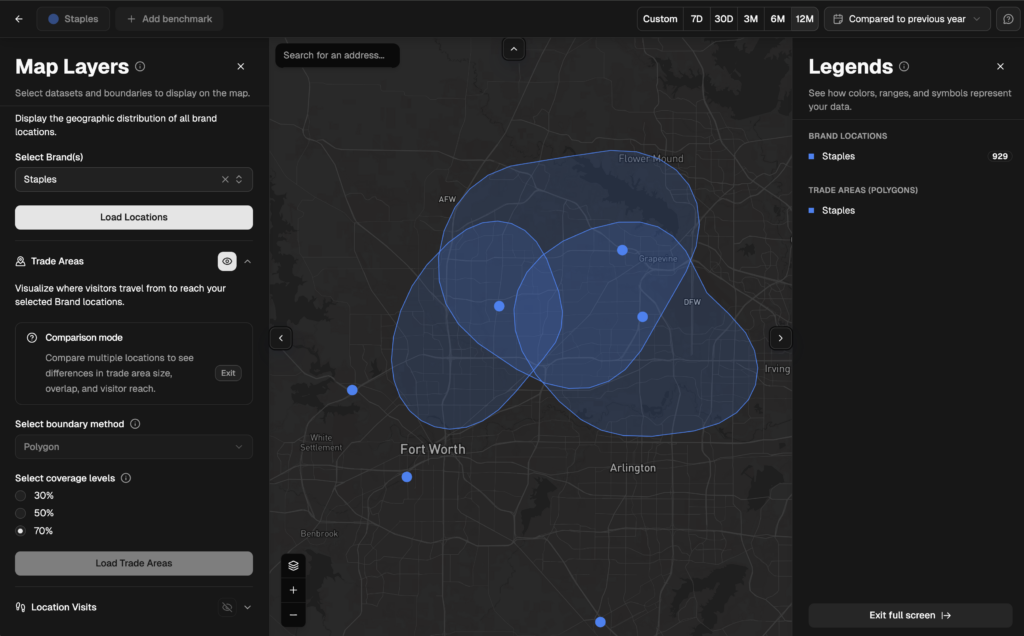
For the full guide on what foot traffic data includes and how it works, see foot traffic data: the complete guide.
Trade area analysis
The trade area defines where a store’s customers come from. Understanding its boundaries, demographics, and dynamics is essential for predicting whether a location will attract enough of the right customers.
Visitor origin data. Where do the people who visit this location come from? How far do they travel? This is not a theoretical trade area drawn on a map. It is an observed trade area built from actual visitor movement data. PassBy’s trade area analysis shows the real catchment for any location, which often differs significantly from the assumed radius-based or drive-time trade area.
Demographic alignment. Does the trade area’s population match your target customer? Income, age, household composition, education, and employment profile all factor into whether a location’s surrounding population is likely to shop at your store. Census data provides the base layer. PassBy overlays this with observed visitor demographics that capture who actually visits the area, not just who lives nearby.
Psychographic profiling. Beyond demographics, what are the lifestyle characteristics of the trade area’s visitors? Do they index on fitness, dining out, luxury shopping, value-seeking, or outdoor recreation? These psychographic signals, derived from observed behaviour patterns, predict brand affinity more accurately than demographic data alone.
For a detailed guide on trade area methodology, see trade area analysis. For understanding catchment areas specifically, see what is a catchment area.
Competitive landscape
Understanding who already operates in and around a candidate location, and how they are performing, directly informs whether the location can support your store.
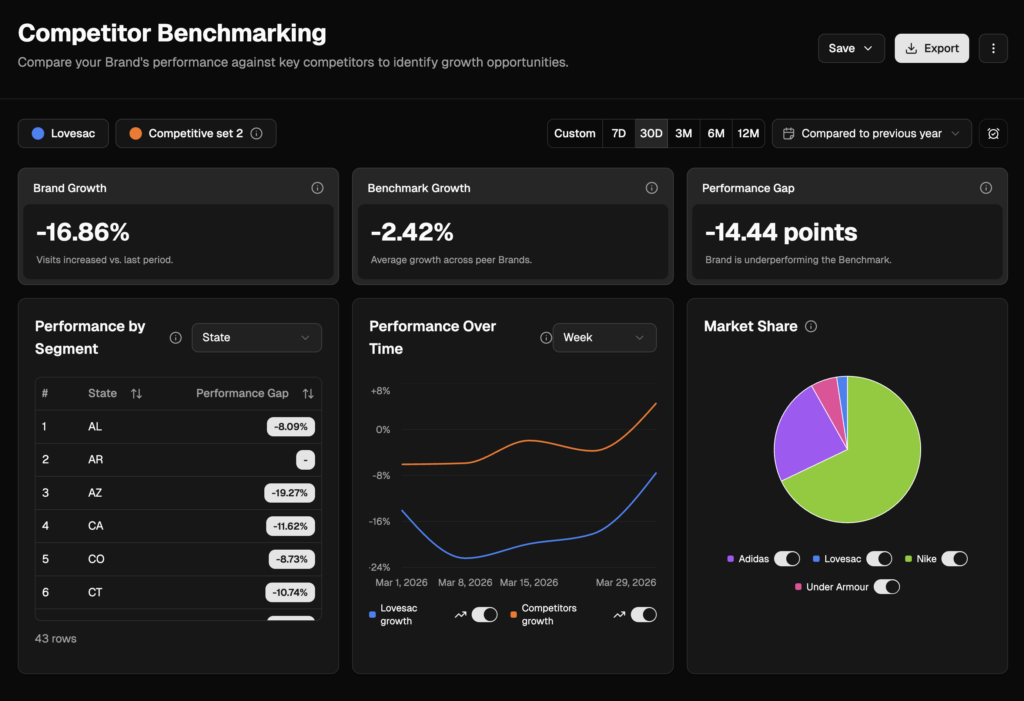
Competitor traffic and performance. How many visits do competitors in the trade area receive? Are they gaining or losing traffic? A competitor with growing traffic in a trade area you are evaluating suggests healthy demand for the category. A competitor with declining traffic may signal a weakening market or an opportunity to capture their customers with a stronger offering.
Competitive density. How many brands in your category already operate within the trade area? High competitive density in a trade area with sufficient demand can work (cluster effects drive traffic). High competitive density in a trade area with limited demand means the market is already saturated.
Cross-visitation and co-tenancy. What other stores do visitors to this location also visit? This reveals the co-tenancy effect: whether the surrounding retail environment creates complementary traffic that benefits your store. A fashion retailer benefits from proximity to beauty and lifestyle brands. A coffee shop benefits from proximity to fitness studios and offices. PassBy’s cross-visitation data quantifies these adjacency effects.
For more on competitive analysis, see competitive intelligence.
Cannibalisation risk
For retailers with existing stores, every new location carries the risk of drawing traffic from an existing store rather than capturing new customers.
Trade area overlap analysis. PassBy’s data shows, for any pair of locations, what percentage of one store’s visitors also visit the other. If a proposed new site has 40% trade area overlap with an existing store, a significant portion of the new store’s traffic may be transferred from the existing location rather than incremental to the network.
Net traffic projection. The question is not “how much traffic will the new store get?” but “how much incremental traffic will the new store add to the network?” A store projected at 5,000 weekly visits with 35% cannibalisation adds approximately 3,250 net new visits. That is the number the financial model should use.
Portfolio optimisation. The same analysis works in reverse for store closures. If a store is underperforming, trade area data predicts where its visitors would go if it closed. If 70% would migrate to another of your locations, the closure preserves most of your traffic. If 70% would go to a competitor, the closure costs you customers permanently.
Financial modelling inputs
Foot traffic data feeds directly into the financial model that determines whether a location is viable.
Revenue projection. Visits x conversion rate x average transaction value = projected revenue. Foot traffic data provides the visits input with a confidence level that broker estimates cannot match. Historical data from comparable stores in your portfolio refines the conversion rate and ATV assumptions.
Rent benchmarking. Knowing the foot traffic at a candidate site relative to comparable locations gives you a data point for rent negotiation. If a landlord is asking premium rent but the location receives 20% less traffic than a comparable site where you pay standard rates, that gap is a negotiation lever.
Scenario modelling. What happens if traffic at the candidate site declines 10% over the next two years? What if a competitor opens nearby? Foot traffic trend data and competitive analysis let you stress-test the financial model against realistic downside scenarios.
The site selection process step by step
Step 1: Define your criteria
Before evaluating any locations, establish the quantitative criteria a site must meet. This typically includes: minimum weekly foot traffic, demographic alignment thresholds, maximum competitive density, maximum trade area overlap with existing stores, and rent-to-projected-revenue ratio. These criteria create an objective filter that prevents emotional attachment to locations that do not meet the requirements.
Step 2: Market identification
Rank markets by strategic fit. Which metros, submarkets, or corridors align with your growth strategy, customer profile, and competitive positioning? PassBy’s data lets you screen markets by foot traffic to your category, demographic composition, competitive landscape, and growth trajectory.
Step 3: Site shortlisting
Within target markets, identify specific locations that meet your criteria. This is where data and broker expertise combine: data surfaces locations that meet the quantitative requirements, and brokers confirm availability and commercial terms.
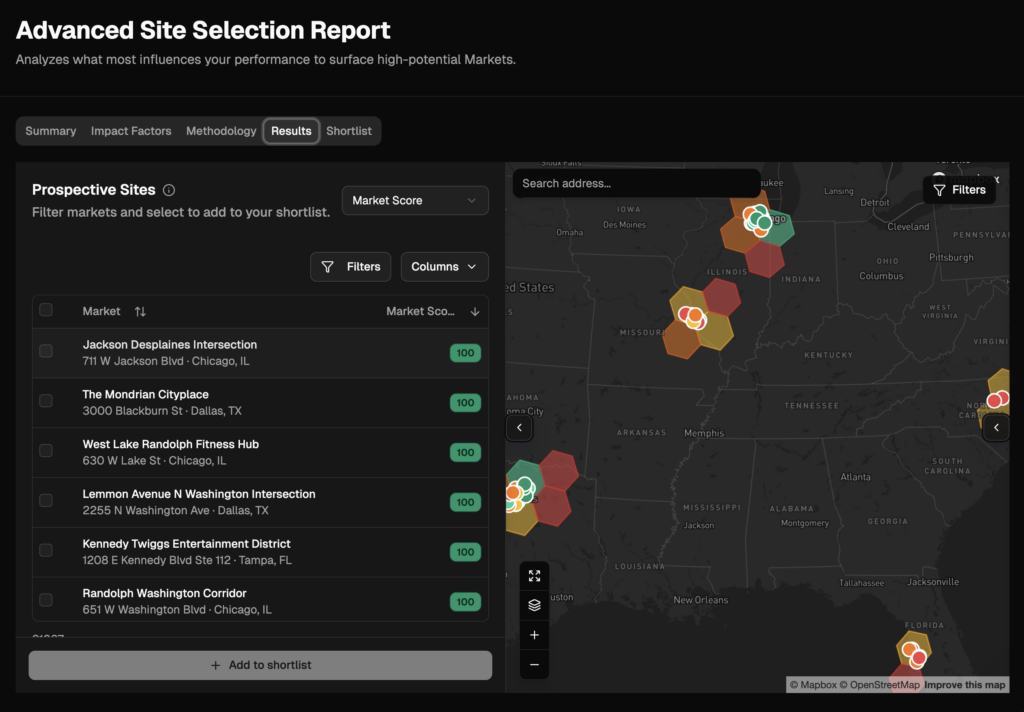
In Almanac, you can evaluate candidate sites using the Markets view, which analyses retail environments (malls, centres, clusters, trade areas) and benchmarks locations against comparable properties. For a walkthrough of how to use Markets for site evaluation, visit the help centre.
Step 4: Deep analysis
For shortlisted sites, conduct the full analysis: foot traffic volume and trends, trade area demographics and psychographics, competitive landscape, cannibalisation modelling, and financial projection. Each site should be evaluated against the same criteria framework established in step 1.
Step 5: Validation
Visit top candidates in person at different times and days to confirm the data matches reality. The data provides the quantitative picture. The visit provides the qualitative context: the feel of the location, the quality of the retail environment, the condition of the property, and the factors that data alone cannot capture.
For high-stakes decisions, a pop-up or temporary location provides the strongest validation. A 3-6 month pop-up in a candidate market generates real performance data for your specific brand at that specific site.
Step 6: Negotiation with data
Enter lease discussions armed with foot traffic benchmarks, competitive data, and financial projections. If you know that a candidate location receives lower traffic than comparable sites, or that the trade area’s demographics are slightly misaligned with your core customer, these data points support negotiation on rent, tenant improvement contributions, or lease terms.
Site selection by retail category
Different retail categories weight the site selection factors differently. The general framework above applies to all retailers, but the emphasis shifts.
Apparel and fashion. Demographic and psychographic alignment matters more than raw traffic volume. The visitor profile must match the brand’s positioning. Format choice (mall vs street vs lifestyle centre) is a brand-positioning decision as much as a real estate decision. See apparel site selection for the category-specific guide.
Restaurant and QSR. Daypart traffic patterns are critical. A breakfast-focused QSR needs morning traffic. A casual dining concept needs evening and weekend traffic. Co-tenancy with complementary brands (grocery, fitness, entertainment) drives visit frequency.
Pharmacy and health. Convenience dominates. The trade area is hyperlocal (under 10 minutes drive). Competitive density within that radius determines viability. Pharmacy closures by CVS, Walgreens, and Rite Aid are creating temporary voids that represent site selection opportunities.
Grocery. Anchor-tenant dynamics matter. A grocery store is often the traffic anchor for a centre, so the co-tenancy calculation is reversed: rather than benefiting from other tenants’ traffic, the grocery store generates traffic that attracts other tenants. Population density and household income within a tight radius are the primary demographic inputs.
Department stores and mall-based retail. Mall-level traffic trends determine the ceiling. PassBy’s data shows super-regional malls declining 1.2% YoY while community centres grow 1.22%. A strong brand in a declining mall faces structural headwinds that no amount of store-level execution can fully overcome.
Getting started with data-driven site selection
PassBy covers 1.5 million US store locations with 5+ years of historical foot traffic data, 90-day predictive feeds, demographic and psychographic profiling, competitive benchmarking, and trade area analysis. Almanac’s Markets view provides the framework for evaluating candidate sites against comparable properties.
For real estate teams evaluating PassBy for the first time, the Test & Learn tier provides 90 days of Almanac access. Enough time to evaluate candidate sites for your current pipeline, benchmark existing stores, and build the internal case for data-driven site selection. See pricing →
For a walkthrough of site evaluation in Almanac, visit the help centre or book a demo →.
FAQ
What is retail site selection? Retail site selection is the process of evaluating and choosing physical locations for new stores. A modern site selection process uses foot traffic data, trade area demographics, competitive analysis, and cannibalisation modelling to objectively assess candidate locations before committing to a lease. The goal is to identify locations where the visitor volume, demographic profile, and competitive landscape support profitable store performance.
What are the most important factors in retail site selection? The five most important factors are: foot traffic volume and trends (how many people visit and whether the trend is positive), trade area demographics (whether the surrounding population matches your target customer), competitive landscape (who else operates nearby and how they are performing), cannibalisation risk (whether a new store would draw from your existing locations), and financial viability (whether projected revenue supports the rent and operating costs).
How much does location affect retail store performance? Location is the single largest determinant of a store’s baseline traffic, which directly drives sales potential. PassBy’s apparel data shows a 30+ percentage point gap in same-store traffic growth between the strongest and weakest brands, with location quality being a major contributing factor. A well-located store in a growing trade area with aligned demographics has a structural advantage that compounding over a 10-year lease.
What is retail site selection software? Site selection software provides the data and analytics tools that real estate teams use to evaluate candidate locations. PassBy’s Almanac platform includes foot traffic analytics, trade area analysis, demographic and psychographic profiling, competitive benchmarking, and predictive forecasts. These tools replace the manual, judgment-based approach with a data-driven framework while still incorporating the qualitative assessment that comes from market experience and site visits. See Almanac for details.
How do you avoid cannibalisation when opening a new store? Trade area overlap analysis shows what percentage of a proposed store’s catchment overlaps with existing locations. Most retailers target less than 25-30% overlap for new stores, meaning at least 70% of the new store’s projected traffic should come from customers not currently served by an existing location. PassBy provides this analysis for any pair of current or proposed locations.
What is the difference between a trade area and a catchment area? A trade area typically refers to the geographic zone from which a store draws customers, defined by observed visitor movement data. A catchment area is often used synonymously, though it can also refer to the broader market area a property or centre serves. In practice, the terms are interchangeable for most retail site selection purposes. See trade area analysis and catchment area analysis for detailed guides.