


A retailer with 200 stores does not have one customer. It has dozens of distinct customer segments visiting different locations at different times, spending different amounts, and responding to different messages. The question is whether your segmentation model reflects that reality or whether it is still based on a census snapshot of the neighborhoods around your stores.
Most retail segmentation starts with demographic data. That is necessary but insufficient. Knowing that your trade area is 45% households earning $75K+ tells you about the population. It does not tell you which of those households actually walk through your doors, how often they visit, what else they buy, or whether they look anything like the customers at your best-performing locations.
The gap between who lives near your stores and who actually shops in them is the gap that separates useful segmentation from expensive guesswork. This guide covers the segmentation methods that matter for retail, how to layer them into a model that predicts behavior, and how each team — real estate, marketing, and store operations — uses customer profiles to make better decisions.
The five segmentation methods that matter for retail
Customer segmentation is not a single technique. It is a set of lenses that reveal different dimensions of your customer base. The methods that matter for physical retail are:
Demographic segmentation
Demographics tell you who your customers are in measurable terms: age, gender, household income, education, family composition, occupation. This is the most accessible segmentation layer because the data is widely available through census sources, panel surveys, and loyalty programs.
Where it works well: Setting baseline expectations for a trade area. If your concept targets households earning $100K+ with children under 18, demographics tell you whether a location has enough of those households to support a store.
Where it falls short: Demographics describe populations, not behaviors. Two neighborhoods with identical income profiles can produce wildly different visit patterns. One may have residents who shop locally. The other may have commuters who shop near their offices. Demographics alone cannot distinguish between them.
Psychographic segmentation
Psychographics tell you why customers make the choices they do: lifestyle preferences, values, interests, attitudes, and personality traits. Esri’s Tapestry system, Claritas PRIZM, and Experian Mosaic are the dominant commercial psychographic datasets.
Where it works well: Understanding the motivation behind purchase behavior. A health food retailer needs to know whether a trade area contains health-conscious consumers — not just high-income consumers who may or may not prioritize wellness. Psychographic segmentation separates “can afford to shop here” from “wants to shop here.”
Where it falls short: Psychographic data is modeled, not observed. It is based on surveys, panel data, and statistical inference applied to geographic areas. The models are good at the segment level but imprecise at the individual level. They also update infrequently — lifestyle preferences can shift faster than annual survey cycles capture.
Geographic segmentation
Geographic segmentation divides customers by where they live or work: country, region, metro, neighborhood, climate zone, urban/suburban/rural classification.
Where it works well: National and regional retailers use geographic segmentation to allocate resources across markets. A retailer with stores in 40 states needs to understand how customer behavior differs between Sun Belt suburbs and Northeastern cities. Catchment area analysis is geographic segmentation applied to a specific location.
Where it falls short: Geographic boundaries are arbitrary. A zip code does not define a customer’s shopping behavior. The power of geographic segmentation increases dramatically when combined with visitation data — seeing where customers actually travel from, not just where they live.
Behavioral segmentation
Behavioral segmentation groups customers by what they do: purchase history, visit frequency, basket size, channel preference, loyalty program engagement, and response to promotions. This is the most directly actionable segmentation for marketing teams.
Where it works well: Identifying your most valuable customers and those at risk of lapsing. RFM analysis (Recency, Frequency, Monetary value) is the classic behavioral framework — it scores customers based on how recently they purchased, how often they purchase, and how much they spend. A customer who scored high on all three dimensions six months ago but has not visited in 90 days is a different kind of problem than a customer who visits monthly but spends minimally.
Where it falls short: Behavioral data from loyalty programs and POS systems only captures customers who transacted. It misses visitors who browsed but did not buy, customers who shopped a competitor instead, and the 40–70% of retail shoppers who do not participate in loyalty programs. This is where foot traffic data fills a critical gap.
Visitation-based segmentation
This is the segmentation layer that most retail guides overlook, and it is the one that changes how every other method works.
Visitation-based segmentation profiles customers by their actual visit behavior: how many people visit a store, when they visit, how long they stay, where they come from, and where else they shop. Unlike behavioral data from loyalty programs (which captures purchases), visitation data captures all visitors — including those who browse without buying, those who visit adjacent stores but not yours, and those who visit competitors in the same trade area.
Why this changes the game:
Traditional approach: You pull census demographics for a 10-minute drive-time ring around your store. The data says the area is 62% households earning $60K–$100K, median age 38, 2.3 children per household. You design your marketing and merchandising around that profile.
Visitation-based approach: You use foot traffic analytics to profile who actually visits. The data shows that 35% of your visitors come from outside the traditional drive-time ring. Your actual visitors skew younger (median 32) and higher-income ($85K median) than the surrounding population. Your weekday visitors are predominantly single professionals. Your weekend visitors are predominantly families. You design separate strategies for each.
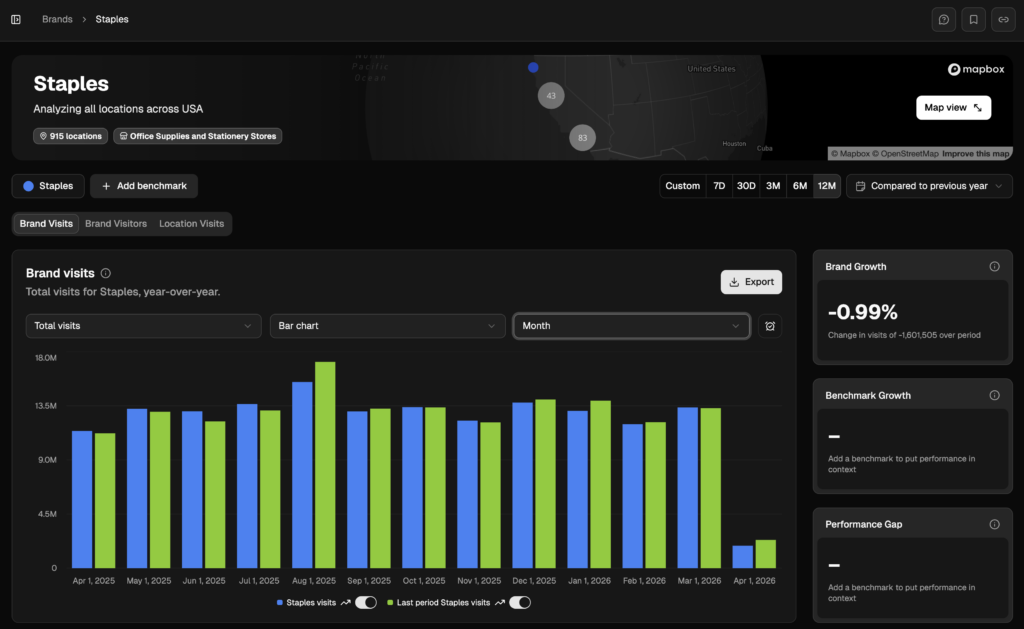
PassBy’s Almanac platform provides visitation-based segmentation for every location in its database — visitor demographics, household income distribution, lifestyle segments, cross-visitation patterns, and visit frequency. This is not modeled from where people live. It is derived from where people actually go. The 94% correlation to ground truth means the profiles are accurate enough to drive real estate and marketing decisions.
How each team uses customer segmentation
The value of customer segmentation depends entirely on what you do with it. Here is how the three primary retail functions — real estate, marketing, and store operations — apply segmentation to their decisions.
Real estate and site selection
For retail real estate teams, customer segmentation answers the most expensive question in the business: should we sign this lease?
Defining the target customer for site scoring. Before you can score a site, you need to define what a good site looks like — and that starts with defining who your target customer is. A segmentation model that combines demographics, psychographics, and visitation behavior from your top-performing stores creates the benchmark profile. New sites are scored based on how closely their trade area demographics and visitor profiles match that benchmark. For the full scoring framework, see our site selection process guide.
Identifying customer density by market. Which markets have the highest concentration of your target customer segments? This drives the market screening stage of site selection. PassBy’s Markets view maps customer segment concentrations across metros and submarkets, showing you where to focus expansion efforts.
Avoiding demographic mirages. A trade area might look perfect on census data — high income, young families, growing population. But visitation data might show that the area’s foot traffic flows to a competing retail cluster five miles away. Customer segmentation that includes visitation behavior catches these patterns before you sign a 10-year lease. For more on this, see our site selection criteria checklist.
Cannibalization modeling. When two stores draw from overlapping customer segments in overlapping trade areas, you risk cannibalizing your own revenue. Visitation-based segmentation reveals the actual extent of customer overlap — not just geographic overlap — between existing and proposed locations. See our cannibalization guide for the full framework.
Marketing and campaign targeting
For marketing teams, segmentation determines who you reach, through which channel, with which message.
Campaign targeting by store-level segments. No two stores have the same customer mix. A chain with 150 locations might have stores that skew heavily toward weekday lunch traffic (urban, professional), stores dominated by weekend family visits (suburban), and stores with a mixed profile. Segmentation at the store level lets you deploy different campaigns to different locations based on who actually shops there — not a single national persona.
Audience overlap and media planning. If you are considering retail media spend or partnership marketing, cross-visitation data shows which other retailers share your customer base. If 22% of your visitors also visit a specific gym chain, that is a co-marketing or retail media network opportunity. If 8% also visit a competitor, that is a conquest targeting opportunity. See our cross-shopping analysis guide for more on how to use this data.
Competitive intelligence. Who shops at your competitors and how do they differ from your customers? Visitation-based segmentation lets you profile your competitors’ visitors alongside your own. If your competitor’s visitors skew older and higher-income while your visitors skew younger and value-oriented, your marketing strategy should lean into that positioning rather than trying to compete head-to-head on dimensions where the competitor is stronger.
Marketing attribution. Did the campaign change who visits? Foot traffic data lets you compare visitor profiles before, during, and after a campaign window. If a campaign was designed to attract younger professionals, did the under-35 share of visitors actually increase during the campaign period? This closes the attribution loop that survey-based methods cannot.
Store operations and merchandising
For store ops and merchandising teams, segmentation determines how the store operates day-to-day.
Staffing by customer segment. If visitation data shows that your weekday morning customers are predominantly retirees and your Saturday afternoon customers are families with children, staffing plans should reflect those patterns — more specialized product knowledge during weekday mornings, more cashier coverage and family-friendly service on weekends.
Assortment localization. A national chain that stocks every store identically is ignoring the customer data it already has. If Store A serves a health-conscious, high-income segment and Store B serves a value-oriented, family segment, the product mix should differ. Visitation-based profiling validates (or challenges) assumptions about who shops at each location, giving the merchandising team a data-backed basis for localization decisions.
Daypart optimization. Customer segments visit at different times. Understanding the daypart mix — who visits in the morning vs. afternoon vs. evening — allows store teams to adjust promotions, sampling, music, and even lighting to match the dominant segment during each window. Foot traffic data from PassBy shows visit patterns by hour and day of week, segmented by visitor demographics.
Building a segmentation model: the practical framework
A segmentation model that sits in a strategy deck and never reaches the stores, the real estate committee, or the campaign manager is not a segmentation model — it is an exercise. Here is how to build one that gets used.
Step 1: Start with your best stores
Your top-performing locations already contain the answers. Pull foot traffic data, visitor demographics, and spending data for your top 20% of stores (by whatever performance metric matters most — revenue, profit margin, traffic growth, or customer lifetime value). These stores define your target customer profile empirically rather than theoretically.
Use PassBy’s Benchmarking Reports to compare the visitor profiles of your top performers against your bottom performers. The differences between those two groups reveal which customer characteristics actually predict store success.
Step 2: Layer the data sources
No single data source produces a complete customer profile. Build your model by layering:
| Layer | What it tells you | Source | Updates |
|---|---|---|---|
| Visitor demographics | Who actually visits (age, income, household composition) | PassBy Almanac | Monthly |
| Psychographics | Lifestyle segments, values, interests | Esri Tapestry, Claritas PRIZM | Annual |
| Behavioral | Purchase history, loyalty engagement, basket size | POS/CRM/loyalty program | Real-time |
| Visitation patterns | Visit frequency, daypart, dwell time, cross-shopping | PassBy Almanac | Monthly |
| Spend data | Category spending, merchant-level spend, share of wallet | PassBy Almanac (card data) | Monthly |
The key is that each layer answers a different question. Demographics tell you who your customers are. Psychographics tell you what they value. Behavioral data tells you what they do in your stores. Visitation data tells you what they do everywhere else. Spend data tells you how much they spend and where.
Step 3: Create actionable segments
Actionable means the segment is large enough to justify a distinct strategy, distinct enough to require one, and measurable enough to track over time. Three to five segments is usually the right number for retail — enough to capture meaningful differences, few enough that each team can realistically execute against them.
For each segment, document:
- Size: What percentage of your visitors belong to this segment?
- Value: What is the average spend, visit frequency, and lifetime value?
- Location concentration: Which stores over-index for this segment?
- Behavioral signatures: When do they visit, how long do they stay, and where else do they shop?
- Growth trajectory: Is this segment growing or shrinking across your portfolio?
Step 4: Validate against store performance
Before you deploy the model, back-test it. Do the segments actually predict store performance? If your model identifies a “high-value family” segment, do the stores with the highest concentration of that segment actually outperform? If not, the model needs refinement.
This validation step is where most segmentation projects fail. Teams build elaborate personas but never check whether the personas correlate with revenue. The difference between a useful segmentation and a decorative one is the validation.
Step 5: Operationalize across teams
Each team needs the segmentation output in a format they can act on:
- Real estate needs segment density maps by market and trade area for site selection scoring
- Marketing needs segment definitions that map to targeting criteria in their campaign platforms
- Store ops needs location-level segment profiles that inform staffing, assortment, and service models
- Finance needs segment-level revenue projections for portfolio optimization and investment decisions
If the segmentation only lives in a strategy team’s PowerPoint, it’s not doing anything. The segments need to flow into the tools and workflows each team already uses.
See how PassBy’s Almanac provides location-level visitor profiling for each of these use cases →
Why traditional segmentation is not enough anymore
The segmentation methods that worked for retail in 2015 are not wrong — they are incomplete. Three shifts have made visitation-based profiling essential:
Remote work changed where people shop. Pre-2020, you could reasonably assume that most of a store’s customers lived or worked within the trade area. That assumption is now broken for many retail categories. A significant share of shopping trips happen during non-commute hours, in areas between home and other destinations, or near schools and gyms rather than near offices. Visitation data captures these patterns. Census demographics do not.
Cross-shopping behavior is more visible. With foot traffic data covering millions of locations, you can now see where your customers shop before and after visiting your store. That cross-visitation data is a segmentation layer that did not exist at scale five years ago. It reveals lifestyle affinities (your customers also visit Whole Foods and Equinox) that are more predictive than income brackets.
Store-level variation is larger than most teams assume. National retailers often build a single customer persona and apply it across the fleet. Visitation data consistently reveals that the actual visitor mix varies dramatically from store to store — even within the same metro area. A segmentation model that accounts for this variation enables store-level strategies. One that does not forces every location to execute the same playbook, regardless of who walks through the door.
Getting started
If your current segmentation is based primarily on census demographics and loyalty data, adding a visitation layer is the highest-impact upgrade you can make. Here is how to start:
- Profile your fleet. Use PassBy’s Almanac to pull visitor demographics, psychographic segments, cross-visitation patterns, and spend data for every location in your portfolio. Compare the profiles of your top performers to your bottom performers. The differences define your target segments.
- Evaluate a new market. Before entering a new market, use visitation-based profiling to see whether the area’s actual visitor mix (not just its resident population) matches your target segments. This is the customer density check that prevents expensive site selection mistakes.
- Test the data. The Test & Learn tier provides 90 days of Almanac access to evaluate the data across your locations. See pricing →
Book a demo to see location-level visitor profiling for your stores →
Frequently asked questions
What is customer segmentation in retail? Customer segmentation is the process of dividing a retail customer base into distinct groups based on shared characteristics — demographics, psychographics, behavior, geography, and visitation patterns. The goal is to enable more targeted strategies across site selection, marketing, merchandising, and store operations. Effective segmentation goes beyond census data to include who actually visits your stores, when, and how they behave.
What are the main types of customer segmentation? The five types that matter for physical retail are: demographic (age, income, household composition), psychographic (lifestyle, values, interests), geographic (location, climate, urban/rural), behavioral (purchase history, visit frequency, loyalty engagement), and visitation-based (who actually visits stores, cross-shopping patterns, dwell time). The most effective models layer multiple types together.
What is the difference between customer segmentation and customer profiling? Segmentation divides your customer base into groups. Profiling creates a detailed description of each group — their demographics, behaviors, preferences, and value to your business. In practice, profiling is the output of segmentation. For a deeper look at what a customer profile contains and how to build one, see our dedicated guide.
How is visitation-based segmentation different from demographic segmentation? Demographic segmentation profiles the population around a store based on census and panel data — who lives or works nearby. Visitation-based segmentation profiles the people who actually visit the store, regardless of where they live. This distinction matters because the resident population and the visitor population can differ significantly — especially in urban areas, near major employers, or in locations that draw from broader trade areas than expected.
How many customer segments should a retailer have? Three to five segments is the typical range for actionable retail segmentation. Fewer than three usually means the segments are too broad to drive distinct strategies. More than seven creates complexity that most marketing and operations teams cannot execute against. The right number depends on how much variation exists in your customer base and how much operational capacity your teams have to customize by segment.
What data do you need for retail customer segmentation? A robust retail segmentation model uses multiple data layers: foot traffic data for visitation patterns and visitor demographics, psychographic data (Esri Tapestry, Claritas PRIZM) for lifestyle segments, POS and loyalty data for purchase behavior, consumer spend data for category-level spending patterns, and cross-visitation data for audience overlap analysis. Platforms like PassBy’s Almanac integrate foot traffic, visitor demographics, spend, and cross-visitation into a single platform.