


Foot traffic is the number of people who enter a physical location within a given time period. In retail, it is the single most important leading indicator of store performance, and it underpins nearly every decision made by store operations, real estate, and marketing teams.
Whether you are evaluating a new site, diagnosing an underperforming store, or measuring the impact of a campaign, foot traffic data provides the behavioural signal that connects physical locations to business outcomes.
This guide covers what foot traffic means in a retail context, why it matters across different functions, what high and low traffic looks like in practice, and how modern data platforms are changing the way retailers use it.
What does foot traffic mean?
Foot traffic, sometimes called footfall, measures the volume of visitors to a physical location. In retail, that location is typically a store, mall, restaurant, or any other commercial point of interest.
The metric itself is straightforward: how many people walked through the door (or entered a defined geographic boundary) during a specific period. But the value of foot traffic comes from what you do with it. When tracked consistently and accurately, foot traffic becomes the foundation for understanding store performance, market dynamics, and consumer behaviour at a granular level.
A few important distinctions that matter in practice:
Visits vs unique visitors. A single customer who visits a store three times in a week counts as three visits but one unique visitor. Both numbers are useful, but they answer different questions. Visit volume tells you about demand. Unique visitor counts tell you about reach.
Foot traffic vs transactions. Not every visit results in a purchase. The gap between traffic and transactions is your conversion rate, and it is one of the most actionable metrics in store operations. A store with declining sales but stable foot traffic has a conversion problem, not a demand problem. A store with declining traffic but stable conversion has a marketing or location problem.
Measured vs modelled. In-store sensors give you a count of people who physically crossed a threshold. Mobile location data models estimate visits based on device signals. Both are valid. The important thing is understanding what your data source actually measures and how it handles edge cases like employee visits, delivery drivers, and pass-through traffic.
Why foot traffic matters in retail
Foot traffic sits upstream of nearly every other retail metric. Sales, conversion, average basket size, and customer acquisition cost all depend on people showing up in the first place.
But beyond being a leading indicator, foot traffic is valuable because it is behavioural. It reflects what people actually do, not what they say they do in a survey or what a model predicts they might do. When a consumer visits a store, that action carries real intent. They made a conscious choice to travel to that location, which is a stronger signal than a click, a page view, or a stated preference.
This behavioural quality makes foot traffic useful across multiple functions:
For store operations teams, foot traffic drives staffing models, opening hours, and in-store layout decisions. If you know that a location sees 40% of its weekly traffic between 11am and 2pm on Saturdays, you can staff accordingly. If a store has strong traffic but weak conversion, the problem is likely in-store execution, not demand.
For real estate teams, foot traffic is fundamental to site selection, lease negotiations, and portfolio optimisation. A location’s traffic volume, the profile of its visitors, and how that traffic trends over time are all inputs into whether a site is worth the investment. Foot traffic data also enables benchmarking: how does this site compare to similar locations in the same market, or to the brand’s top-performing stores?
For marketing teams, foot traffic closes the loop on campaign measurement. Digital marketing can track impressions and clicks, but measuring whether a campaign actually drove people into a store requires physical visit data. Foot traffic attribution lets marketing teams connect spend to real-world outcomes and optimise accordingly.
High foot traffic vs low foot traffic
High foot traffic areas are locations with consistently large visitor volumes. In retail, these tend to be shopping malls, major high streets, transit hubs, and areas anchored by strong destination tenants. Examples in the US include Fifth Avenue in Manhattan, the Magnificent Mile in Chicago, and the Mall of America in Minnesota.
High traffic alone does not guarantee success. A location on a busy street may see thousands of people pass by every day, but if those people are commuters rather than shoppers, or if the demographics do not match your customer base, the traffic is not working for you. The quality of traffic, who the visitors are, where they come from, and whether they match your target profile, matters as much as the quantity.
Low foot traffic areas are not inherently bad either. A specialty retailer with a loyal customer base may do very well in a location with moderate traffic if conversion rates are high and average order values are strong. The question is always whether the traffic level, combined with your economics, supports a viable store.
What makes foot traffic analysis powerful is the ability to move beyond simple volume counts and understand traffic in context. That means looking at:
- Trends over time. Is traffic growing, stable, or declining? Seasonal patterns? Year-over-year shifts?
- Visitor profiles. What are the demographic and psychographic characteristics of the people visiting?
- Trade area. How far are visitors travelling? What does the catchment look like?
- Competitive dynamics. How does your traffic compare to competitors in the same trade area?
- Day and time patterns. When do visitors come? How does that align with your operating hours?

How foot traffic data is collected?
Foot traffic data comes from a range of sources, and the collection method determines what the data can and cannot tell you. At a high level, there are two categories: in-store hardware and external data platforms.
In-store hardware includes infrared beam counters, thermal cameras, pressure mats, and WiFi/Bluetooth sensors. These tools measure traffic at a specific entrance or zone within a store. They are precise for that single location but tell you nothing about competitors, the broader market, or where your visitors came from.
External data platforms use aggregated, anonymised signals from mobile devices to model visits across millions of locations. This is the approach used by PassBy, Placer.ai, and other location intelligence providers. The advantage is scale: you get a consistent lens across your entire portfolio, your competitors, and the wider market, without installing any hardware.
The two approaches are complementary. In-store sensors give you a ground-truth count at a single door. External platforms give you the broader context: market share, competitive benchmarking, trade area analysis, and visitor demographics across every location in the country.
For a detailed breakdown of the different collection methods, their accuracy tradeoffs, and how to choose the right approach, see our guide to how to measure foot traffic.
For a comparison of the major data providers, see foot traffic data providers compared.
How different teams use foot traffic
Foot traffic is not a metric that lives in one department. Different teams use it in different ways, and the questions they ask of the data are distinct.
Store operations
Store operations teams use foot traffic to run stores more efficiently. The core questions are:
- How should we staff this location? Mapping traffic patterns to shift schedules ensures the right number of people are on the floor at the right times. Overstaffing during quiet periods wastes labour budget. Understaffing during peaks costs sales.
- Are our operating hours right? If a location sees meaningful traffic before or after current opening hours, extending hours may capture incremental revenue. If traffic drops to near zero in the last hour, closing earlier saves costs without losing sales.
- Which stores are underperforming relative to their traffic? A store with strong traffic but weak sales has an execution problem. A store with weak traffic but strong conversion has a demand problem. The fix is different for each.
- How do events and promotions affect visits? Measuring the foot traffic lift from a promotional event tells you whether the investment paid off in physical visits, separate from whatever it did for brand awareness.

Real estate and site selection
Real estate teams use foot traffic as a core input into location decisions. Every site evaluation starts with a question about demand, and foot traffic is the most direct measure of it.
- Is this a strong site? Absolute traffic volume, combined with trends and visitor profiles, tells you whether a location has the demand to support a store.
- How does this site compare to our best-performing locations? Benchmarking a potential site against your top stores (on traffic, demographics, and trade area characteristics) predicts how it will perform.
- What is the trade area? Understanding where visitors come from, how far they travel, and what other locations they visit helps you assess cannibalisation risk and market coverage.
- What happens if we close this store? Modelling where your traffic would migrate to, whether it goes to another of your stores or to a competitor, is essential for portfolio optimisation.
For more on this use case, see our guide to retail site selection and trade area analysis.

Marketing
Marketing teams use foot traffic to understand whether their campaigns are driving physical visits and to profile their audience for better targeting.
- Did our campaign drive store visits? Comparing foot traffic before, during, and after a campaign period, while controlling for seasonal patterns and competitor trends, tells you whether the investment generated incremental visits.
- Who is visiting our stores? Demographic and psychographic profiles of visitors help marketing teams tailor messaging, select media channels, and design promotions that resonate with the actual customer base rather than an assumed one.
- Which competitor is winning in our markets? Tracking competitors’ traffic trends alongside your own reveals whether you are gaining or losing share in specific geographies.
For more on using foot traffic in marketing, see our guide to retail marketing strategies.

What foot traffic data actually looks like
If you have not worked with foot traffic data before, it helps to understand the typical outputs. Modern platforms provide several layers of analysis, not just a single visit count.
Visit trends. Time-series data showing daily, weekly, or monthly visit volumes. This is the most basic output, and it is the starting point for most analyses. You can compare periods (this quarter vs last quarter, this year vs last year), overlay competitors, and identify seasonal patterns.
Trade area analysis. A geographic view of where your visitors come from, typically visualised as a heatmap or set of concentric zones. Trade area data helps with site selection, cannibalisation analysis, and understanding your actual catchment versus your assumed one.
Demographic and psychographic profiles. Aggregated, anonymised characteristics of your visitor base: age ranges, income levels, education, lifestyle interests. These are modelled from the mobile device signals and cross-referenced against census and survey data.
Competitive benchmarking. Side-by-side comparisons of your traffic against competitors in the same market, region, or nationally. This tells you whether changes in your traffic are driven by your own performance or by broader market shifts.
Predictive feeds. Forward-looking visit estimates based on historical patterns, seasonality, and AI models. PassBy provides 90-day predictive feeds validated against ground-truth data, which enables proactive planning for staffing, inventory, and marketing timing.
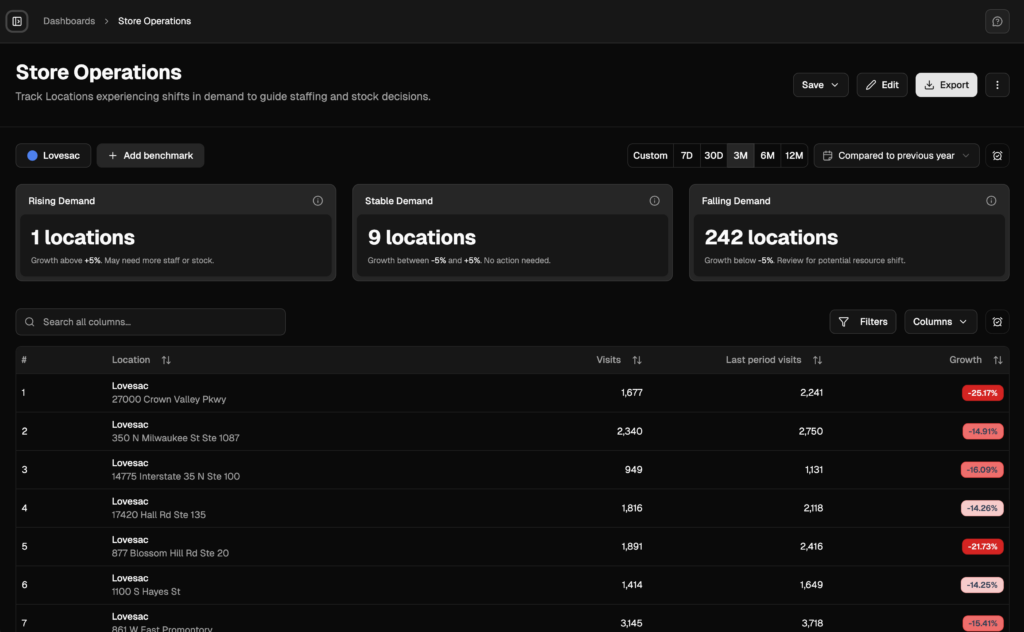
For details on accessing this data via API or cloud delivery, see our guide to foot traffic data APIs.
Foot traffic vs other retail metrics
Foot traffic does not replace other retail metrics. It complements them by adding a layer of behavioural context that internal data alone cannot provide.
Foot traffic vs POS data. Point-of-sale data tells you what sold, when, and for how much. It does not tell you how many people visited and did not buy, what competitors are experiencing, or what your traffic looks like relative to the market. Combining traffic with POS data gives you conversion rate, which is one of the most diagnostic metrics in retail.
Foot traffic vs web analytics. Online analytics track clicks, impressions, and digital conversions. Foot traffic data extends this into the physical world, allowing omnichannel retailers to measure the full customer journey from digital touchpoint to in-store visit.
Foot traffic vs survey data. Surveys capture stated preferences and self-reported behaviour. Foot traffic captures actual behaviour. The two can diverge significantly, as consumers often overstate how frequently they visit a store or understate how far they are willing to travel.
Foot traffic vs internal sensor data. In-store sensors provide a precise count at a single location. External foot traffic data provides cross-market comparisons, competitor intelligence, and trade area analysis. The former is a thermometer. The latter is a weather map.
FAQ
What does foot traffic mean? Foot traffic is the number of people who visit a physical location within a defined time period. In retail, it refers to the volume of shoppers entering a store, mall, or commercial area.
What is an example of foot traffic? A grocery store that receives 3,200 visits per week has a weekly foot traffic count of 3,200. That number can be broken down by day, hour, or compared against the same week in prior years to identify trends.
What is considered high foot traffic? High foot traffic is relative to the location type and market. A store on Fifth Avenue in Manhattan may see tens of thousands of visitors daily, while a strong-performing suburban strip mall location might see a few hundred. What matters is whether the traffic level, combined with conversion rates and average transaction values, supports the business economics.
What is foot traffic in marketing? In marketing, foot traffic is used to measure the physical-world impact of campaigns. By comparing visit volumes before, during, and after a campaign, and controlling for seasonal trends, marketers can assess whether their spend drove incremental store visits.
How is foot traffic measured? Foot traffic can be measured using in-store hardware (sensors, cameras, counters) or external data platforms that model visits from aggregated mobile device signals. For a detailed comparison of methods, see our guide to how to measure foot traffic.
What is the difference between foot traffic and footfall? They mean the same thing. Foot traffic is more commonly used in the US, while footfall is more common in the UK and Europe.
How do I get foot traffic data? You can get foot traffic data from location intelligence platforms like PassBy, which provides visit data, demographic profiles, trade area analysis, and competitive benchmarking across millions of locations. See how Almanac works →