


A site selection decision that takes six months and costs $40,000 in analytics time is not inherently better than one that takes six weeks. What matters is whether the process produces sites that perform — stores that hit their revenue targets, draw from the right trade area, and strengthen the portfolio rather than cannibalize it.
Most retail real estate teams have a site selection process. Fewer have one that is documented, repeatable, and connected to the data that actually predicts store performance. The process often lives in the head of a senior VP, relies on relationships with the right brokers, and skips steps when the timeline is tight or the deal seems obvious.
This guide lays out the full site selection process in seven stages, from initial market screening through post-opening validation. At each stage, we cover what the team needs to decide, what data supports the decision, where most teams get stuck, and how to avoid the mistakes that lead to underperforming locations.
If you need a primer on what site selection is and why it matters, start with our pillar guide. If you already have a shortlist and want the evaluation checklist, go to our site selection criteria guide. This page covers the process between those two — the workflow that turns a growth mandate into a signed lease at the right location.
Stage 1: Define the growth mandate
Every site selection process starts with a strategic question that is bigger than any individual site. Before the real estate team looks at a single property, they need clarity on what the business is trying to achieve.
The questions this stage answers
- Are we expanding into new markets or filling gaps in existing ones?
- How many locations does the portfolio need in the next 12–36 months?
- What revenue target does each new store need to hit to meet the investment case?
- Are there format considerations — full-size stores, smaller footprints, pop-up concepts?
Why this stage matters
The growth mandate shapes every downstream decision. A retailer filling in a mature market with strong brand awareness uses a different process than one entering a region where they have no stores. An expansion strategy targeting 50 new locations in 24 months requires a different data infrastructure and decision cadence than one targeting five locations per year.
Teams that skip this stage end up evaluating sites against criteria that were never formally agreed. The real estate team scores a location as strong while the finance team rejects it because the revenue model assumed a different format or market position.
What you need
- Alignment between real estate, finance, and operations on the number of locations, timeline, and financial targets
- A clear view of which markets are already penetrated and where white space exists
- Format definitions that specify the square footage range, required co-tenancy, and minimum population density
Stage 2: Screen and prioritize markets
Once the growth mandate is set, the next step is identifying which markets should receive investment. For national retailers, this means ranking dozens or hundreds of possible metros, trading areas, or submarkets. For regional retailers, it means choosing neighborhoods within markets they already know.
The questions this stage answers
- Which markets have the highest concentration of our target customer profile?
- Where is demand underserved relative to supply?
- How does the competitive landscape vary across candidate markets?
- Which markets show traffic and spending growth trends that align with our growth timeline?
What the data needs to show
Customer density. Where do your ideal customers live in the highest concentrations? This requires mapping your existing customer profile against population data, not just total population but the specific demographic and psychographic segments that drive your business.
Market demand. How much spending exists in each candidate market in your product category? If you are a specialty grocer, you need to see total grocery spend per capita, share of organic and natural spend, and how that spending has trended over the past two years.
Competitive saturation. How many direct and indirect competitors operate in each market? What is the ratio of competitor locations to target customers? A market with high customer density but heavy competitive presence may be less attractive than a market with moderate density and no competitors.
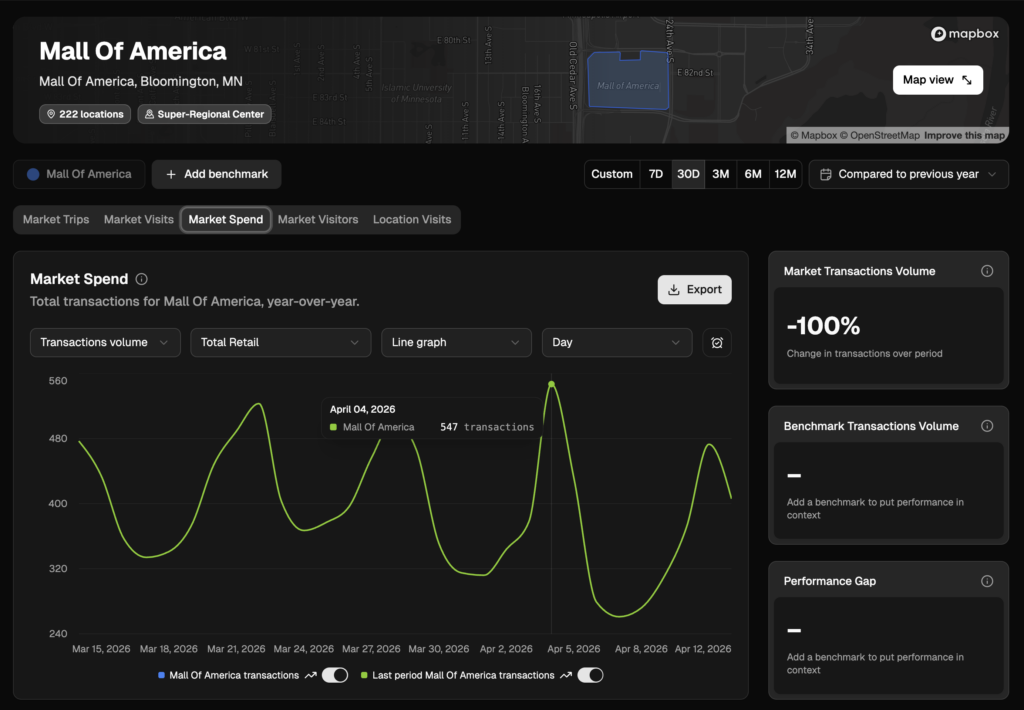
Foot traffic trends. Markets are not static. A submarket that showed strong foot traffic growth 18 months ago may have plateaued. Conversely, a developing area with rising traffic and new residential construction may be worth entering early. PassBy’s Almanac platform provides market-level foot traffic data with five years of history — enough to separate structural trends from seasonal noise.
Where teams get stuck
The most common mistake at this stage is relying on a single data dimension. A market that looks strong on demographics may have unfavorable traffic trends. A market with growing traffic may have a customer profile that does not match your brand. Market screening works only when it integrates multiple layers — demographics, traffic, spend, and competition — and weights them according to what actually predicts your stores’ performance.
Stage 3: Define trade areas and identify sites
With markets ranked and prioritized, the real estate team shifts to finding specific sites within those markets. This is where the process moves from strategic to tactical.
The questions this stage answers
- What does the trade area look like for each candidate site?
- Where will the store draw customers from — and does that overlap with existing locations?
- How accessible is the site by car and on foot?
- What does the co-tenancy look like, and does it generate compatible traffic?
Defining the trade area
The trade area is the geographic zone from which a store draws the majority of its customers. The method you use to define it matters:
Radius-based trade areas are the simplest approach — draw a circle around a site and analyze what is inside. They are fast but inaccurate. A 3-mile radius captures customers who live across a highway with no practical access while missing customers who live 5 miles away on a direct arterial.
Drive-time trade areas are more realistic. A 10-minute drive-time polygon accounts for road networks, traffic patterns, and natural barriers. This is what most sophisticated retail teams use as a baseline. For an overview of the different trade area methods, see our dedicated guide.
Actual visitation-based trade areas are the most accurate. Instead of modeling where customers should come from, you use foot traffic data to see where they actually come from. PassBy’s Almanac generates trade areas based on real visitation patterns — showing you the true draw of a location, not a theoretical one. This matters most for sites near natural barriers, in dense urban areas, or adjacent to strong traffic generators that distort pull patterns.
Sourcing sites
Real estate teams source sites through a combination of:
- Broker relationships and off-market deal flow
- CoStar, Crexi, and LoopNet listings for available spaces
- Drive-the-market tours where team members physically visit candidate areas
- Systematic screening using foot traffic data providers to identify high-traffic properties with available space
The best teams combine all four. Relying entirely on broker deal flow means you only see what brokers want to show you. Relying entirely on data means you miss the physical realities — the awkward parking lot, the construction project next door, the billboard that blocks visibility from the main road.
Stage 4: Score and rank candidate sites
Once you have a shortlist of candidate sites, you need a systematic way to compare them. This is where the site scoring model comes in.
Building a scoring model
A site scoring model assigns weighted scores to the factors that predict store performance in your business. The specific criteria vary by concept, but the architecture is consistent:
| Category | Example criteria | Data source | Typical weight |
|---|---|---|---|
| Traffic & demand | Daily foot traffic, traffic growth trend, weekday/weekend split | PassBy Almanac | 25–30% |
| Customer match | Trade area demographics vs. target customer profile, household income, lifestyle segments | PassBy Almanac, Census | 20–25% |
| Competitive landscape | Number of direct competitors within trade area, competitive benchmarking metrics, market saturation index | PassBy Almanac | 15–20% |
| Spend opportunity | Category spend per capita, total addressable spend in trade area, spend growth trend | PassBy Almanac, card data | 10–15% |
| Physical site | Visibility, access/egress, parking, signage potential, condition | Physical visit, broker | 10–15% |
| Real estate terms | Rent per SF, lease duration, TI allowance, exclusivity clauses | Broker, CoStar | 10–15% |
The weighting problem
The weights are where most scoring models either succeed or fail. Teams that weight every category equally end up with a model that does not predict anything useful — a site with perfect demographics but terrible visibility scores the same as a site with strong traffic but mismatched demographics.
The right approach is to back-test against your existing portfolio. Which factors most strongly correlate with your top-performing stores? If your best stores all share high weekday foot traffic and strong co-tenancy with grocery anchors but vary widely on household income, then traffic and co-tenancy should carry more weight than demographics.
PassBy’s Benchmarking Reports let you analyze the foot traffic profiles of your existing locations — top performers vs. bottom performers — to identify which traffic patterns, demographic profiles, and competitive dynamics predict success in your specific business.
Where site selection analytics fits
Site selection analytics is the application of data — foot traffic, demographics, spend, competition — to the scoring and ranking process. It replaces gut feel and anecdotal broker assessments with quantified metrics that can be compared objectively across sites.
The difference between a team that uses site selection analytics and one that does not is not just accuracy — it is speed and consistency. When every site is scored against the same model, the real estate committee can evaluate ten sites in an hour instead of spending a full day debating subjective impressions.
For a look at the software platforms that automate parts of this process, see our tools guide.
Stage 5: Cannibalization and portfolio impact analysis
A site can score well on every individual criterion and still be a bad decision for the portfolio. That happens when the new store pulls customers from existing locations rather than capturing new demand.
The questions this stage answers
- How much trade area overlap exists between the candidate site and existing stores?
- What percentage of the new store’s projected traffic would come from customers who currently visit another location in the portfolio?
- Is the net portfolio impact positive — does total revenue increase, even if individual store revenue at nearby locations declines?
How to model cannibalization
Cannibalization analysis requires overlaying the trade areas of your existing stores with the trade area of the candidate site. The key metric is shared customer potential — what percentage of the new store’s projected customer base already shops at one of your other locations.
Foot traffic data makes this analysis significantly more reliable. Instead of modeling trade area overlap based on drive-time polygons (which assume customers always go to the nearest store), you can use actual visitation patterns from PassBy to see where your existing stores’ customers actually come from. If real visitation data shows that 35% of the candidate trade area already shops at your store five miles away, you can model the revenue transfer.
The goal is not zero cannibalization — some overlap is expected and acceptable in most growth strategies. The goal is to ensure net portfolio gain. A new store that cannibalizes $500,000 from an existing location but generates $2.5 million in total revenue is a $2 million net addition. A new store that cannibalizes $1.2 million and generates $1.5 million is a $300,000 net addition — possibly not worth the capital.
For a deeper framework, see our retail cannibalization guide.
Stage 6: Financial modeling and committee approval
Once a site has passed the scoring model and the cannibalization check, the real estate team builds the financial model and presents it to the investment committee (or equivalent decision-making body).
What the financial model needs
- Revenue projection based on the trade area’s customer density, category spend, traffic patterns, and the performance of comparable stores
- Occupancy cost including base rent, CAM, taxes, insurance, and any percentage rent provisions
- Build-out and fit-out costs based on the site’s condition and the concept’s requirements
- Operating cost assumptions for labor, inventory, marketing, and logistics
- Payback period and IRR that meet the company’s investment hurdle rate
How data strengthens committee presentations
Investment committee members are evaluating risk. The question behind every site presentation is: how confident are we that this location will perform?
Sites presented with foot traffic data and trade area analytics are substantially easier to defend. Instead of “this is a busy intersection” (subjective), the team can present “this location averages 4,200 unique daily visitors, 63% of whom match our target demographic, with traffic growing 8% year-over-year while the nearest competitor has declined 4%.” That shifts the conversation from opinion to evidence.
The strongest presentations also show comparables — how the candidate site’s traffic profile, demographic mix, and competitive environment compare to the top-performing stores already in the portfolio. PassBy’s Benchmarking Reports provide this comparison directly, showing how a candidate location stacks up against existing stores on the metrics that matter.
Talk to PassBy about how Almanac supports real estate committee presentations →
Common reasons sites get rejected at committee
- Revenue projections are based on demographic data alone, with no traffic validation
- Cannibalization impact is not quantified — the committee is told “minimal overlap” without supporting data
- The competitive landscape is described generically (“there are two competitors nearby”) rather than with specific traffic and performance data
- The financial model assumes a ramp-up timeline that has no basis in comparable store performance
Stage 7: Post-opening validation and feedback loop
The site selection process does not end when the lease is signed or the store opens. The most disciplined teams track how new locations perform against their pre-opening projections and feed that information back into the scoring model.
What to track
- Actual foot traffic vs. projected foot traffic — compare real visitation data from PassBy against the pre-opening traffic estimates. This reveals whether the site is drawing as expected or whether the trade area is performing differently than modeled.
- Customer profile accuracy — does the actual visitor demographic match what the pre-opening analysis predicted? If the site projected a high-income family audience but is drawing a younger, lower-spend demographic, the scoring model needs adjustment.
- Cannibalization actuals — has the new store affected nearby locations’ traffic? Compare the traffic trends at existing stores before and after the opening. PassBy’s historical data makes this comparison straightforward.
- Revenue ramp-up curve — how does the store’s first 6, 12, and 18 months compare to projections and to comparable stores?
Closing the feedback loop
The point of validation is not to grade past decisions — it is to improve future ones. If your scoring model consistently underweights co-tenancy and overweights household income, the validation data will reveal that pattern. Teams that systematically update their scoring weights based on actual store performance make better site decisions over time.
This is also where portfolio optimization connects to site selection. The same data that validates new store performance can be used to identify which existing locations need intervention — format changes, marketing shifts, or in some cases, closure.
How to run this process faster without cutting corners
The seven-stage process described above is thorough but not fast. In competitive real estate markets, speed matters — the best sites do not stay available for months while your team runs analysis.
Three approaches shorten the timeline without sacrificing quality:
1. Pre-build your scoring model before you need it. Do not wait until you have a site to define what a good site looks like. Build and validate your scoring model during a quiet period. When a site becomes available, you can score it in days, not weeks.
2. Use a platform that integrates the data layers. If foot traffic data lives in one platform, demographics in another, and competitive intelligence in a third, assembling the input for a single site takes days. Almanac integrates foot traffic, trade areas, demographics, spend, and competitive benchmarking in a single platform — which means a site can be screened, scored, and benchmarked in hours. See how it works →
3. Standardize your committee package. Create a template that covers traffic, demographics, cannibalization, financials, and comparables in a consistent format. When the committee sees the same structure every time, reviews take an hour instead of a half-day debate.
The Test & Learn tier provides 90 days of Almanac access to evaluate the data and workflow fit for your team before committing to an annual plan. See pricing →
Frequently asked questions
What is the site selection process? The site selection process is the end-to-end workflow that retail and restaurant companies use to identify, evaluate, and secure new store locations. It typically includes seven stages: defining the growth mandate, screening markets, identifying candidate sites, scoring and ranking locations, analyzing cannibalization impact, building financial models for committee approval, and validating performance after opening.
What is site selection analytics? Site selection analytics is the use of data — including foot traffic, demographics, consumer spend, and competitive benchmarking — to quantify the potential of a location. It replaces subjective assessments with metrics that can be consistently measured and compared across sites, enabling faster and more accurate real estate decisions.
How long does the site selection process take? Timelines vary significantly depending on the company’s size, the number of sites being evaluated, and the team’s data infrastructure. A single-site evaluation with an established scoring model can take 2–4 weeks. A full market expansion study that includes market screening, site identification, and financial modeling for multiple locations typically takes 3–6 months.
What is the most important factor in retail site selection? No single factor dominates in isolation. Research consistently shows that the combination of foot traffic volume and quality, alignment between trade area demographics and the brand’s target customer, and manageable competitive intensity produces the strongest site performance. The relative importance varies by concept — a convenience store may weight traffic volume highest, while a luxury retailer may weight customer affluence highest.
How do you measure whether a site selection was successful? Compare actual store performance against pre-opening projections across four dimensions: foot traffic (actual vs. projected daily visitors), customer profile (actual visitor demographics vs. target), revenue ramp-up (actual sales trajectory vs. comparable stores), and portfolio impact (effect on nearby existing locations). Teams that systematically track these metrics improve their site selection criteria over time.
What data do you need for site selection? Effective site selection requires multiple data layers working together: foot traffic data (visit volumes, trends, daypart patterns), trade area demographics (who visits the area, not just who lives nearby), consumer spend data (category spending levels and trends), competitive data (competitor locations, performance, and market share), and commercial real estate data (availability, rents, lease terms). Platforms like PassBy’s Almanac integrate the first four categories, while listing data comes from CoStar, Crexi, or broker relationships.