


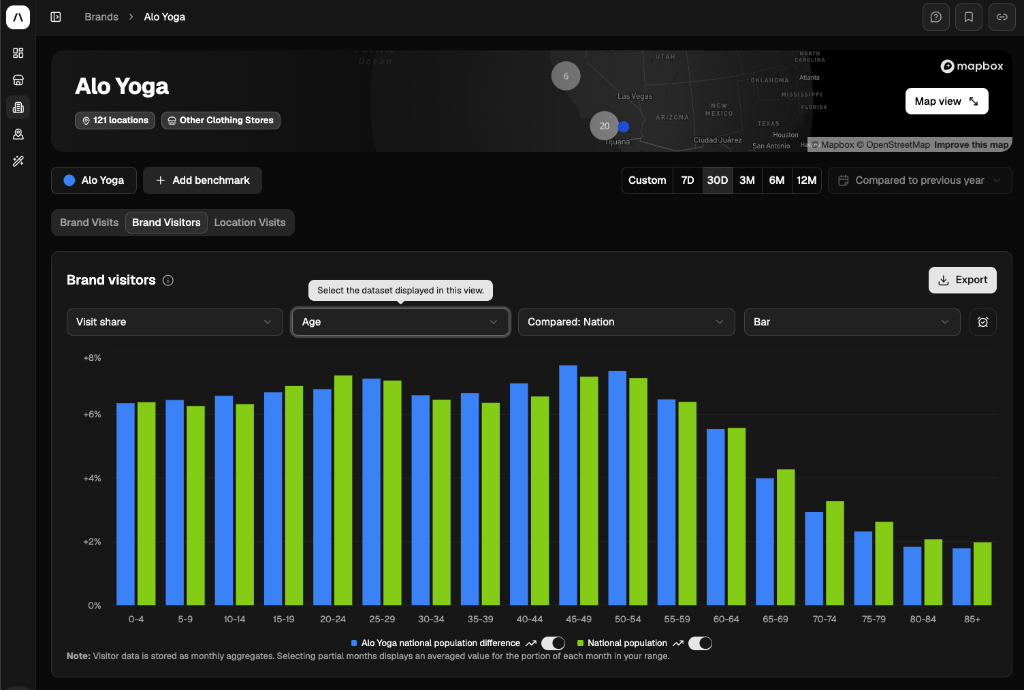
A customer profile is a detailed description of who your customers are — their demographics, behaviors, preferences, and value to your business. It is the foundation that every other retail decision sits on: where you open stores, how you staff them, who you market to, and what you stock on the shelves.
That definition is straightforward. The execution is where most retailers go wrong.
The typical customer profile is built from a combination of loyalty programme data (which only captures enrolled members), census demographics (which describe residents, not visitors), and internal assumptions (which reflect what the team believes, not what the data shows). The result is a profile that describes an averaged, idealised customer who may not exist in any meaningful concentration at any of your actual stores.
This guide covers what a customer profile should contain, how to build one from data that reflects real visitor behavior, and how retail teams — real estate, marketing, and operations — use profiles to make better decisions. If you need the broader methodology for dividing your customer base into groups, start with our customer segmentation guide. If you want the practical walkthrough for building full personas, see our retail customer personas guide.
What a customer profile contains
A useful retail customer profile has six dimensions. Each one answers a different question about who your customer is and how they behave.
1. Demographics
The factual foundation: age range, household income, education level, household composition (singles, couples, families with children, empty nesters), and occupation type.
Demographics answer the question: who is this customer?
This is the most accessible data layer — available through census sources, loyalty programmes, and third-party providers. But it is also the most commonly misused. A demographic profile that describes the population around your stores is not the same as a profile of the people who actually visit. That distinction — between residents and visitors — matters more than most retailers realise.
2. Psychographics
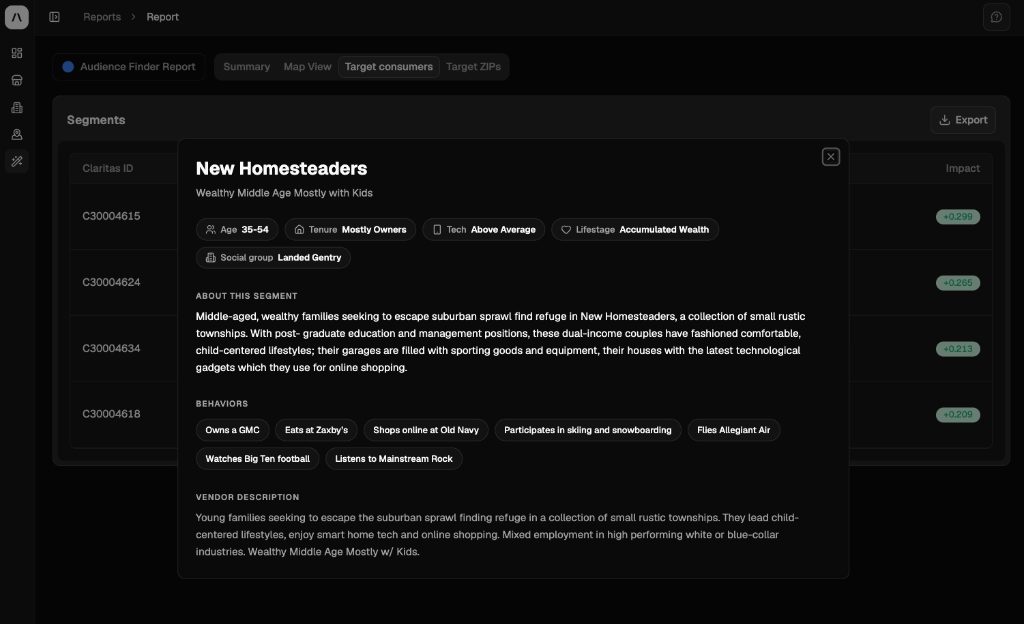
The motivational layer: lifestyle preferences, values, interests, attitudes, and media consumption habits. Commercial psychographic datasets like Esri’s Tapestry or Claritas PRIZM classify populations into lifestyle segments (e.g., “Metro Renters,” “Soccer Moms,” “Young and Restless”).
Psychographics answer the question: why does this customer choose you?
A health food retailer and a discount grocer might serve trade areas with similar income profiles. The difference is psychographic — one area skews toward health-conscious, quality-driven households; the other toward value-oriented, convenience-driven households.
3. Visit behavior
How the customer interacts with your physical stores: visit frequency, average dwell time, peak visit times (daypart), weekday vs. weekend patterns, and seasonal variation.
Visit behavior answers the question: how does this customer shop?
This dimension is where foot traffic data adds a layer that loyalty data alone cannot provide. Loyalty programmes capture transactions, but they miss the 40–70% of visitors who do not participate. They also miss visits where a customer browsed but did not buy. Foot traffic data captures all visitors, regardless of whether they transacted.
4. Spending profile
What the customer spends: average transaction value, category preferences, purchase frequency, share of wallet (what percentage of their total category spending goes to you vs. competitors), and spend trends over time.
Spending profile answers the question: how valuable is this customer?
The most useful spending profiles combine your own POS data (what they spend with you) with external spend data (what they spend across the category). A customer who spends £80 per visit at your store looks valuable in isolation. If their total monthly category spend is £400 and they give £320 of it to a competitor, the profile tells a different story — and suggests a different strategy.
5. Cross-shopping behavior
Where else your customer shops: which other retail brands they visit, how frequently, and in what sequence. Cross-visitation data reveals brand affinities, competitive overlaps, and lifestyle patterns that no survey could capture at scale.
Cross-shopping answers the question: who are you competing with for this customer?
If 28% of your visitors also visit a premium fitness brand and 22% also visit an organic grocery chain, that tells you something about their lifestyle that a demographic profile alone would not. It also identifies co-marketing partners and conquest marketing targets.
6. Geographic origin
Where the customer comes from: their home location, the distance they travel to reach your store, and the trade area they define through their actual visitation patterns.
Geographic origin answers the question: where should you be reaching this customer?
Traditional profiles assume a circular trade area based on drive-time models. Visitation-based profiles reveal the actual shape of your customer base — which is almost never circular. A store near a motorway interchange may draw heavily from a suburb 20 minutes away while getting almost no visitors from the neighbourhood directly behind it.
The two types of customer profile — and why it matters which one you use
Most guides treat customer profiling as a single discipline. In practice, there are two fundamentally different approaches, and they produce different profiles.
Resident-based profiles
Built from census data, demographic surveys, and panel-based estimates. These profiles describe the population that lives within a defined distance of your store.
Inputs: Census Bureau data, American Community Survey, Esri demographics, panel surveys
What it tells you: Who lives near your store
Refresh frequency: Annual (census) or quarterly (panel estimates)
Best used for: Market-level planning, long-range expansion strategy, initial site screening
Limitation: Residents ≠ visitors. In urban areas, near employment centres, in tourist zones, and along commute corridors, the people who visit a store can be completely different from the people who live nearby. A store in central London may serve commuters from Essex, not residents from the surrounding borough.
Visitor-based profiles
Built from foot traffic analytics, mobile device data, and in-store sensors. These profiles describe the people who actually walk through your doors.
Inputs: Mobile location data (PassBy), in-store sensors, Wi-Fi/Bluetooth signals
What it tells you: Who actually visits your store
Refresh frequency: Monthly or weekly
Best used for: Site validation, marketing targeting, store operations, competitive benchmarking
Advantage: Captures the real customer, not a modelled approximation. Shows variation between locations. Includes non-transacting visitors that loyalty data misses.
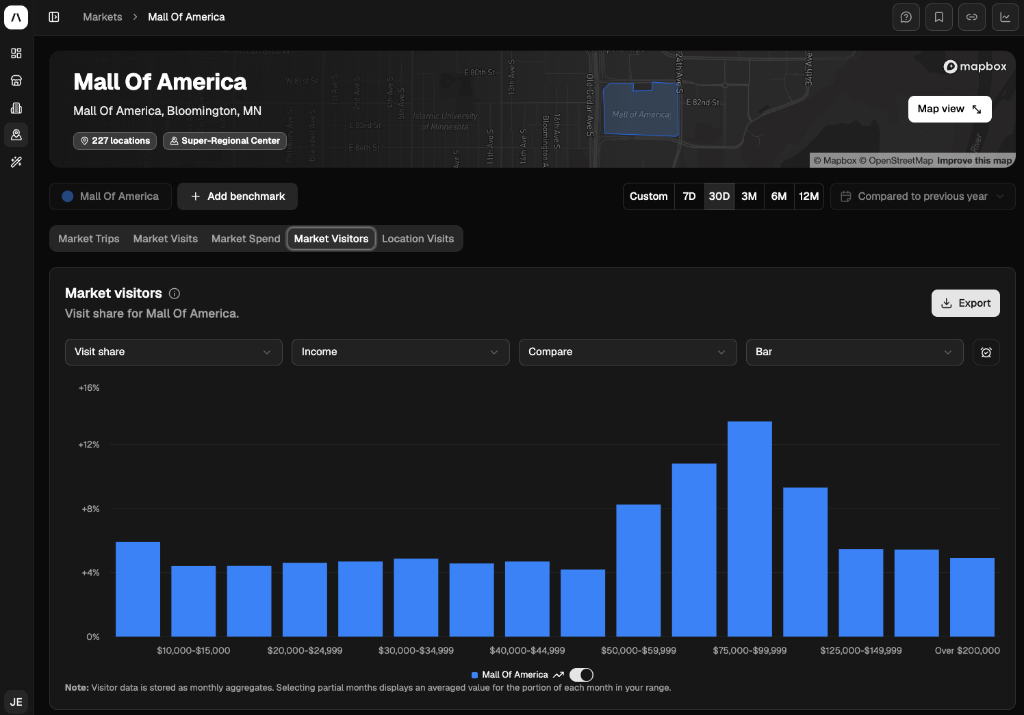
PassBy’s Almanac provides visitor-based profiling for over 2 million retail locations — visitor demographics, psychographic segments, cross-visitation patterns, and visit frequency — all derived from actual visitation data validated against in-store hardware sensors at 94% correlation.
Why the distinction matters
Consider a hypothetical: a retailer evaluating a site in a growing suburb. The resident-based profile shows median household income of £85,000, median age 42, predominantly families with school-age children. It looks like a perfect match for the brand’s target customer.
But the visitor-based profile for existing retailers at the same address tells a different story. The area draws 40% of its visitors from a neighbouring lower-income suburb (they are driving to the retail cluster for variety). The actual visitor median age is 34, not 42. And the dominant psychographic segment is “young urban professionals” rather than “established families.”
A resident-based profile would greenlight this site. A visitor-based profile would flag the mismatch between the brand’s target customer and the location’s actual visitor base.
For site selection, this is the difference between a profitable location and a $3M mistake.
How to build a customer profile: the five-step process
Step 1: Start with your best-performing stores
Your top stores already contain the answer. Pull visitor data from your highest-performing locations (by revenue, profit, or traffic growth) and profile who visits them.
Use PassBy’s Benchmarking Reports to compare the visitor profiles of your top 20% against your bottom 20%. The differences between those two groups define your target customer — empirically, not theoretically.
Step 2: Layer multiple data sources
No single source produces a complete profile. The strongest profiles combine:
| Data layer | What it adds | Source |
|---|---|---|
| Visitor demographics | Who actually visits (age, income, household) | PassBy Almanac |
| Psychographics | Lifestyle segments, values, interests | Esri Tapestry, Claritas PRIZM |
| Purchase behavior | Transaction history, basket size, category mix | POS / CRM / loyalty |
| Visit patterns | Frequency, dwell time, daypart, seasonality | PassBy Almanac |
| Cross-visitation | Where else they shop | PassBy Almanac |
| Spend data | Category spending, merchant-level spend | Card transaction data |
Each layer answers a different question. Demographics tell you who your customers are. Psychographics tell you what they value. Behavioral data tells you what they do in your stores. Visitation data tells you what they do everywhere else.
Step 3: Build location-level profiles, not a single national profile
This is where most retail profiling goes wrong. The standard approach produces one averaged profile for the entire brand. But a retailer with 200 stores does not have one customer. It has dozens of distinct customer profiles that vary by location.
A store in central Manchester and a store in a suburban retail park outside Leeds will have different visitor demographics, different peak dayparts, different cross-shopping patterns, and different competitive dynamics. A single national profile obscures these differences rather than illuminating them.
Build profiles at the location level first. Then look for clusters of similar stores to create segment-level profiles that are specific enough to drive decisions.
Step 4: Validate against performance
A customer profile that does not predict store performance is decoration, not a tool.
Test your profiles by checking:
- Do stores with a higher concentration of your target customer profile actually outperform?
- Do the demographic and behavioral characteristics in the profile correlate with revenue, conversion rate, or traffic growth?
- If you identify a “high-value” customer type, do stores where that type dominates generate more revenue per square foot?
If the profiles do not correlate with any performance metric, they need to be rebuilt. For the full validation framework, see our customer segmentation guide.
Step 5: Operationalise across teams
Each team needs the profile in a different format:
- Real estate needs customer density maps by market and trade area for site scoring
- Marketing needs profile definitions that map to targeting criteria in campaign platforms
- Store ops needs location-level profiles that inform staffing patterns and service models
- Merchandising needs profiles that justify assortment and planogram variation by store cluster
If the profile only exists in a strategy presentation, it is not doing anything. It needs to flow into the tools each team already uses.
How each retail team uses customer profiles
Site selection
Customer profiles answer the most expensive question in retail: will this site work?
When you know who your target customer is — defined by actual visitor data from your best stores — you can evaluate any candidate location by profiling its existing visitors and comparing. If the visitor profile at a candidate site matches your top performers, it is a strong signal. If it matches your bottom performers, it is a warning.
This approach also strengthens cannibalisation analysis. Two stores that overlap geographically but draw from different customer profiles may not cannibalise each other at all. Conversely, two stores 15 miles apart that draw the same customer profile from overlapping trade areas may cannibalise significantly.
For the full site evaluation framework, see our site selection process guide.
Marketing
Customer profiles determine who you reach, through which channel, with which message.
Store-level targeting. If Store A’s profile skews toward weekday professionals and Store B’s profile skews toward weekend families, the campaign strategy should differ — different creative, different channels, different daypart emphasis.
Competitive conquest. Cross-shopping data within the profile reveals which competitors share your customers. If 25% of your visitors also visit a specific competitor, that competitor’s locations become your conquest marketing targets.
Campaign measurement. Did the campaign change who visits? Compare visitor profiles before, during, and after a campaign window. If a campaign targeted younger demographics, did the under-35 share of visitors actually increase?
Store operations
Staffing. Visitor profiles by daypart tell you who shows up when. Weekday morning professionals expect speed and efficiency. Weekend families expect different service. Staff accordingly.
Service design. If the dominant profile at a location cross-shops at premium brands and has high household income, the service expectations are different than a location where the dominant profile is value-oriented.
Performance diagnosis. If a store’s traffic is declining, the profile can tell you whether you are losing a specific customer segment or losing across the board. The first scenario suggests a targeted fix. The second suggests a structural problem.
Common mistakes in customer profiling
Mistake 1: Using census data as a proxy for visitor data. Census demographics tell you about the neighbourhood, not the customers. For many retail categories, these are different populations.
Mistake 2: Building one profile for the whole brand. Your stores serve different customers in different locations. A single national profile is an average that represents nobody.
Mistake 3: Never validating against performance. If the profile does not predict which stores succeed and which struggle, it is an opinion, not a tool.
Mistake 4: Profiling only transacting customers. Loyalty programme data captures members who bought something. It misses browsers, one-time visitors, and the majority of shoppers who do not enrol. Foot traffic data fills this gap.
Mistake 5: Setting and forgetting. Customer profiles shift as demographics change, competitors open and close, and consumer behavior evolves. Quarterly refreshes are the minimum for a useful profile.
Getting started
If your current customer profiles are built primarily from census data and loyalty programme extracts, adding a visitor-based layer is the single highest-impact upgrade you can make.
- Profile your existing portfolio. Use PassBy’s Almanac to pull visitor demographics, psychographic segments, cross-visitation patterns, and visit frequency for every store. Compare top performers to bottom performers. The differences define your target customer.
- Evaluate a new market. Before entering a new market, use visitor-based profiling to check whether the area’s actual visitors (not just residents) match your target profile.
- Test the data. The Test & Learn tier provides 90 days of Almanac access to evaluate the data across your locations. See pricing →
Book a demo to see visitor-based profiling for your stores →
Frequently asked questions
What is a customer profile?
A customer profile is a detailed description of who your customers are — their demographics, behaviors, preferences, spending patterns, and value to your business. In retail, the most effective profiles are built from actual visitor data (foot traffic analytics) rather than census estimates alone, because the people who live near a store and the people who visit it are often different populations.
What should a retail customer profile include?
A complete retail customer profile includes six dimensions: demographics (age, income, household composition), psychographics (lifestyle segments and values), visit behavior (frequency, dwell time, peak dayparts), spending profile (transaction value, category preferences, share of wallet), cross-shopping behavior (which other brands they visit), and geographic origin (where they travel from). The combination of these layers produces a profile that predicts store performance.
What is the difference between a customer profile and a customer persona?
A customer profile is a data-driven description of a customer segment — quantified demographics, behaviors, and spending patterns. A customer persona adds a narrative layer — a named, memorable representation of that segment designed to make the data actionable for teams who do not work directly with analytics. The profile is the data. The persona is the story that makes the data usable.
How do you build a customer profile from foot traffic data?
Start with your best-performing stores. Pull visitor demographics, visit patterns, and cross-visitation data from a platform like PassBy’s Almanac. Compare the visitor profiles of your top 20% of stores against your bottom 20%. The characteristics that differentiate high performers from low performers define your target customer profile. Then validate by checking whether stores with higher concentrations of that profile actually outperform. See our customer segmentation guide for the full methodology.
What is the difference between a resident-based and visitor-based customer profile?
A resident-based profile describes who lives near a store (from census data). A visitor-based profile describes who actually visits the store (from foot traffic data). The difference can be significant — especially in urban areas, near employment centres, tourist zones, or along commute corridors where visitors may travel from well outside the traditional trade area. Visitor-based profiles are more accurate for site selection, marketing targeting, and store operations because they reflect actual customer behavior rather than geographic proximity.
How often should customer profiles be updated?
Quarterly refreshes are the standard for well-run retail programmes. Customer behavior shifts as competitors open, demographics evolve, and economic conditions change. At minimum, refresh annually — but the best organisations track key profile metrics monthly and flag significant shifts for investigation.