

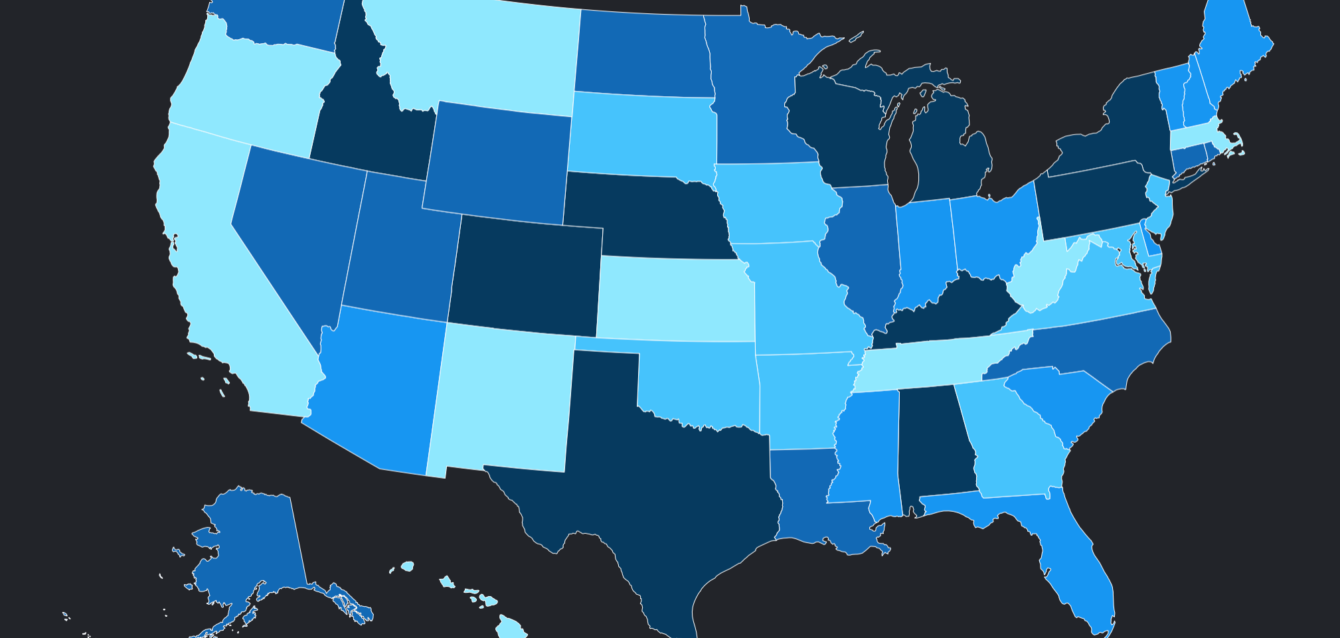
Visits to shoe store retailers across the US declined 5.58% year-over-year, according to PassBy foot traffic data. What does this mean for shoe retailers?
We’re taking a look at the data, state by state, looking at the example of Foot Locker, and finding out why this decline has been so widespread.
- Visits to footwear stores declined by 5.58% year-over-year, with Q4 2024 seeing the sharpest decline at -8.38%.
- Oklahoma saw the steepest decline in traffic at -9.93% year-over-year
- Wyoming saw the smallest decline in traffic at -2.73% year-over-year
- Visits to Foot Locker declined by -5.93% year-over-year
Shoe store visits have declined every quarter
The decline in footwear retail foot traffic isn’t limited to a single period. PassBy’s data shows that visits to shoe store retailers were lower year-over-year in every quarter analyzed, with the size of the decline varying throughout the period.
The sharpest decline came in Q4 2025, when visits fell 8.38% year-over-year. This was followed by a smaller decline of 5.61% in Q1 2026, while the most recent quarters show signs of the gap narrowing.
The biggest decline came during Q4
Q4 stands out as the weakest quarter in the dataset, with visits to shoe retailers down 8.38% year-over-year.
- Foot traffic then improved relative to the previous year in Q1, with the decline narrowing to 5.61%, before narrowing further to 3.12% in Q2.
- The latest Q3 data shows a 3.56% decline, meaning visits remain below the previous year’s level, but the gap is considerably smaller than it was at the end of 2025.
This suggests that while footwear retailers are still experiencing a year-over-year traffic decline, the rate of decline has moderated since the sharp drop seen in Q4 2025.
Is footwear foot traffic beginning to stabilize?
The quarterly trend raises an important question for footwear retailers: has the market moved past its steepest decline?
The data does not yet show a return to year-over-year growth, so it would be too early to describe the market as fully recovered. However, the move from an 8.38% decline in Q4 2025 to a 3.12% decline in Q2 2026 represents a meaningful improvement in the rate of traffic loss.
For retailers, this makes the next few quarters particularly important. Continued moderation could indicate that footwear foot traffic is stabilizing, while another widening of the year-over-year gap could signal renewed pressure on physical store visits.
Footwear foot traffic is declining across every state
No state has experienced growth in visits to shoe stores in the past year, but the picture is different across the country with some states seeing a much steeper decline than others.
- The five states experiencing the sharpest decline in footwear visits were Oklahoma (-9.93%), Louisiana, Arkansas, West Virginiam, and New Mexico.
- The five states experiencing the least decline in footwear visits were Wyoming, Maine, California, Kansas, and Iowa.
- Overall, visits to shoe stores declined by -5.58% year-over-year.
Foot Locker reflects the wider footwear trend
- Outlets, regional and super regional centres account for 64% of overall traffic in the past year.
- Overall visits declined by -5.93%, while visits to outlet, regional and super regionals declined by -5.9%.
Foot Locker’s overall decline of 5.93% is broadly consistent with the 5.58% decline across shoe store retailers, suggesting that the reduction in physical visits isn’t unique to one footwear brand.
While this example doesn’t reflect the entire market, it presents a retailer-level example that broadly mirrors the wider category trend.
To see how your brand has performed compared to your industry, speak to our team.
This data includes visits to outlet, super and regional stores only and compares growth year-over-year.
To breakdown your brand’s performance by state or portfolio by category type, use the Market dashboard in Almanac.
All states see a decline in visits to Foot Locker outlet, regional and super-regional stores
Why is footwear foot traffic in decline?
Changing consumer behaviour
Consumers may be making fewer dedicated trips to physical footwear stores and purchasing footwear through other channels.
E-commerce and omnichannel shopping
Online purchasing can reduce the need for consumers to visit a physical store, particularly for repeat purchases or familiar brands.
Consumer spending pressure
If consumers are becoming more selective about discretionary purchases, footwear purchases may be postponed or consolidated.
Retail consolidation
Store closures or changes to retail footprints can also affect physical visits.
Different shopping missions
Consumers may increasingly purchase shoes as part of broader shopping trips rather than making a dedicated visit to a footwear retailer.
There are many reasons why this decline can be seen across the states, but none are definitive and if your brand is seeing a decline in visits it’s always worth further investigation.
What does the decline in traffic mean for footwear retailers?
- Location performance matters more than ever.
A national decline doesn’t mean every store is performing equally. Retailers need to understand which markets are outperforming the category. - Benchmarking is critical.
A -5% decline might look negative in isolation, but if competitors in the same market are down -8%, the store could actually be outperforming its competitive set. - Store format matters.
The Foot Locker data showing that outlet, regional and superregional centres account for 64% of traffic gives you an opportunity to explore how different retail environments are performing. - National averages can hide local opportunities.
Wyoming’s -2.73% decline looks very different from Oklahoma’s -9.93%. Retailers shouldn’t necessarily respond to a national trend with a uniform strategy.
Footwear retail faces a broad traffic challenge
For footwear retailers, the headline decline is only the starting point. The bigger opportunity is understanding where performance differs from the national trend, how individual stores compare with their competitive markets, and which locations are showing resilience.
To benchmark performance, see if your store(s) are over or underperforming by using PassBy.
See where you stand now so you can make your next steps with confidence. Contact our team.