


If you already know what foot traffic is and you are evaluating how to get the data, this is where to start.
Foot traffic data has become a core input for retailers making site selection decisions, operations teams optimising store performance, and investors building alternative data models. The challenge is not whether to use it. The challenge is understanding what you are actually buying, how to evaluate the quality of different data sources, and how to connect it to the decisions your team makes every day.
This guide covers what foot traffic data includes, how it is produced, what separates good data from bad, and how retail, real estate, and finance teams are putting it to work.
What foot traffic data actually includes
Foot traffic data is not a single metric. It is a collection of datasets that describe how people move through physical spaces. Depending on the provider and the product, foot traffic data can include some or all of the following:
- Visit counts. The foundational layer. How many visits occurred at a specific location during a given period. This can be delivered as daily, weekly, or monthly aggregates, or as event-level records with timestamps.
- Unique visitors. Distinct devices (as a proxy for distinct people) observed at a location. The ratio of visits to unique visitors tells you about repeat behaviour. A coffee shop with 10,000 monthly visits and 3,000 unique visitors has a very different profile from one with 10,000 visits and 8,000 uniques.
- Dwell time. How long visitors spend at a location. Dwell time separates a quick errand from an extended shopping trip, and it varies meaningfully by retail category. A grocery run averages 20-30 minutes. A furniture store visit might be over an hour.
- Visit frequency and loyalty. How often the same visitors return over a given period. High repeat rates indicate a loyal customer base. Declining frequency can be an early warning sign before it shows up in revenue.
- Trade area. The geographic origin of visitors, typically mapped by zip code or census block group. Trade area data answers the question: where are your customers coming from, and how far are they willing to travel?
- Demographics and psychographics. Aggregated, anonymised characteristics of the visitor population: age distribution, income levels, education, lifestyle interests, household composition. These are modelled by cross-referencing device-level location signals with census, survey, and consumer panel data.
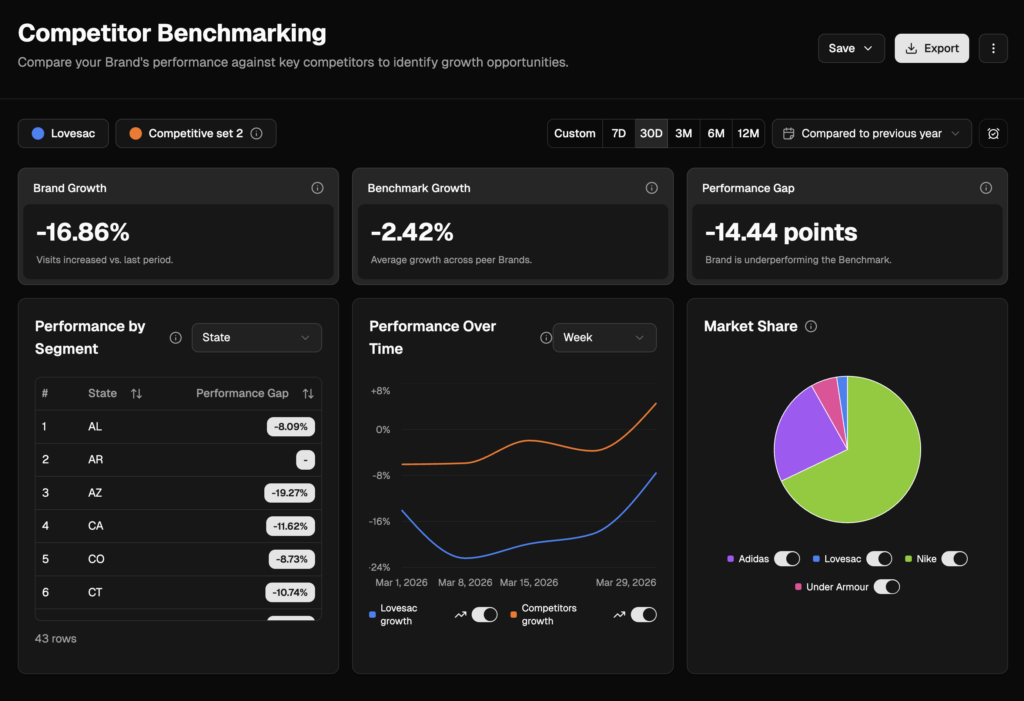
- Competitive benchmarking. Visit data for locations you do not own. This is one of the most valuable aspects of third-party foot traffic data: the ability to see how your competitors are performing in the same market, using the same methodology, so comparisons are apples to apples.
- Predictive estimates. Forward-looking visit forecasts based on historical patterns, seasonality, and machine learning models. PassBy provides 90-day predictive feeds, validated against ground-truth data from in-store sensors and sales records.
Not every provider offers all of these. When evaluating options, the right question is not “which provider has the most features” but “which provider delivers the specific datasets my team needs, at the accuracy level we require.”
Where foot traffic data comes from
The quality of foot traffic data is determined by the sources it draws from and the methodology used to model visits from those sources. Understanding the supply chain matters, because the same term (“foot traffic data”) can refer to very different things depending on who produces it.
Mobile location data
The primary source for most third-party foot traffic analytics. Aggregated, anonymised location signals from mobile devices are used to detect when a device enters a defined geographic boundary (a store polygon or point of interest). These signals come from GPS, WiFi positioning, Bluetooth, and cellular network data.
The raw signals are noisy. A GPS ping might place a device inside a store when the person is actually in the car park. A WiFi signal might register a device on a different floor of a shopping centre. The value of a foot traffic provider is in the modelling layer: cleaning the noise, deduplicating signals, filtering out employees and delivery drivers, and scaling a panel of observed devices up to represent the full population.
This is where providers diverge most. The size and composition of the device panel, the quality of the POI database (how accurately store boundaries are defined), the number of independent data inputs used for validation, and the sophistication of the modelling all determine whether the output is reliable or misleading.
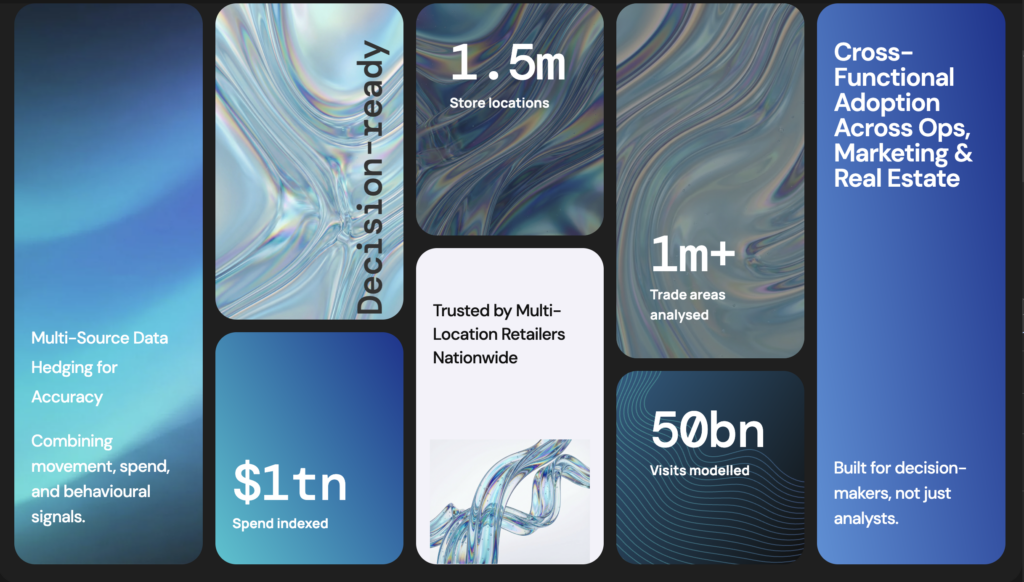
PassBy uses over 15 independent data inputs and validates against hundreds of thousands of in-store sensors and sales data records, achieving 94% correlation to ground truth. That validation step is not universal across the industry.
In-store sensors and cameras
Hardware installed at store entrances (infrared beams, thermal cameras, pressure mats) that count people as they enter and exit. These provide a precise count for a single location but do not capture trade area data, competitor visits, or visitor demographics.
WiFi and Bluetooth signals
Networks within a store can detect devices with WiFi or Bluetooth enabled, even if the device does not connect. This provides visit and dwell time data for a single location, but coverage depends on consumer device settings and opt-in rates have declined as privacy controls have tightened.
Purchase and transaction data
Point-of-sale records can serve as a proxy for visits, but they only capture visitors who bought something. Browsers, returners, and comparison shoppers are invisible.
Blended approaches
The most reliable foot traffic analytics combine multiple source types. Using mobile location data as the primary signal, then validating and calibrating against in-store sensor counts, transaction records, and other ground-truth sources produces a dataset that is both broad (covering millions of locations) and accurate (validated at the individual store level).
For a detailed comparison of providers who offer this data, see our guide to foot traffic data providers.
How to evaluate foot traffic data quality
Not all foot traffic data is created equal, and the differences matter. A site selection decision based on inaccurate visit estimates can result in a lease commitment on a location that underperforms from day one. An investor model built on unreliable foot traffic signals will generate false signals.
Here is what to look for when evaluating a provider:
Accuracy and validation
Ask how the provider validates their data. Specifically:
- What is their stated correlation to ground truth? (And what does “ground truth” mean to them? In-store sensors? Sales data? Third-party audits?)
- How many validation points do they use?
- Is validation performed at the aggregate level or at the individual store level?
- How often is validation updated?
Some providers publish an accuracy figure without disclosing the methodology behind it. Others validate against a small sample and extrapolate. The gold standard is continuous validation against a large, diverse set of ground-truth sources across multiple retail categories and geographies.
Panel size and composition
A larger device panel generally means better coverage, but composition matters more than raw size. A panel that skews heavily toward one demographic, one geography, or one device type will produce biased estimates. Ask about the panel’s demographic distribution and how the provider adjusts for known biases.
POI quality
Foot traffic data is only as good as the points of interest it is mapped against. If a store’s geographic boundary is incorrectly defined, visits will be over- or under-counted. Ask how the provider maintains their POI database, how frequently it is updated, and how they handle complex locations like shopping centres where multiple stores share a building footprint.
Coverage
How many locations does the provider cover? Can they provide data for your entire portfolio, your competitors, and the markets you are evaluating? Is coverage consistent across urban and suburban areas, or does it drop off outside major metros?
Historical depth
How far back does the data go? Historical depth matters for trend analysis, seasonality modelling, and backtesting. PassBy provides over five years of historical data, which is enough to cover pre-pandemic baselines, the disruption period, and the recovery.
Freshness and latency
How quickly is new data available? For some use cases (weekly performance reporting, campaign measurement), a 48-hour lag is fine. For others (real-time staffing adjustments, dynamic pricing), near-real-time is required. Understand what the provider delivers and whether it matches your operational cadence.
Privacy and compliance
All reputable foot traffic providers work with anonymised, aggregated data. But “anonymised” means different things to different companies. Ask about GDPR and CCPA compliance, data retention policies, and whether the provider has been independently audited. PassBy maintains no record of personal data and is ISO 27001 certified.
How retail teams use foot traffic data
The same underlying data serves very different purposes depending on who is using it. Here is how the three core retail functions put foot traffic analytics to work.
Store operations: diagnose, benchmark, act
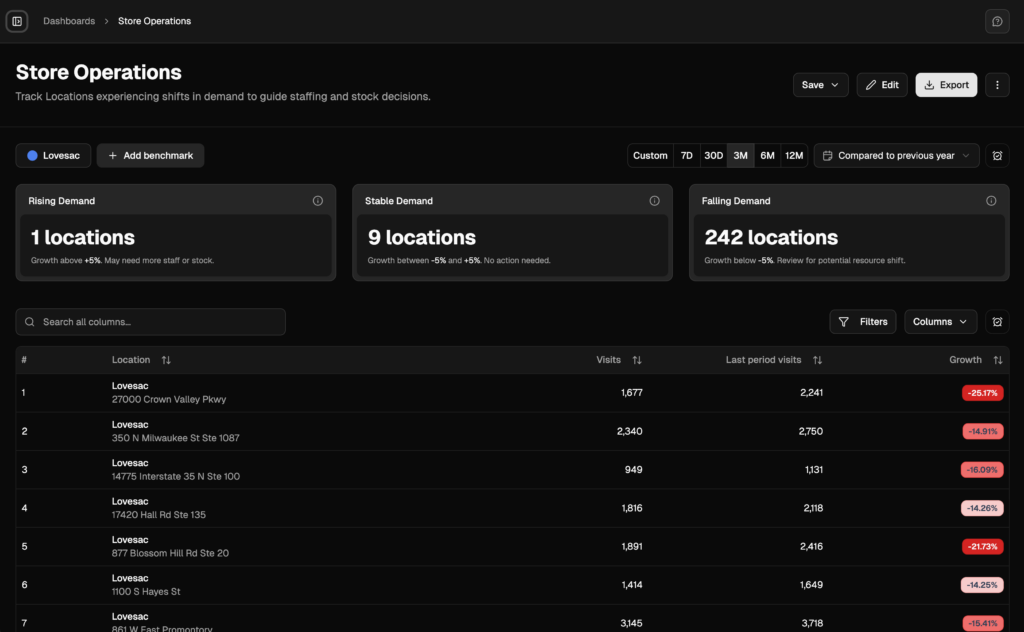
Operations teams live in the detail of individual store performance. Foot traffic data lets them move beyond revenue reporting (which is a lagging indicator) and into diagnostic analysis that explains why a store is performing the way it is.
Performance diagnosis. When a store misses its sales target, foot traffic data tells you whether the problem is demand (fewer people showing up) or execution (same traffic, fewer conversions). Those two problems require completely different interventions.
Staffing optimisation. Mapping hourly and daily visit patterns against labour schedules reveals misalignment. A store that is understaffed during its Saturday afternoon peak is leaving money on the table. A store that is overstaffed on Tuesday mornings is burning labour budget for no return.
Operating hours. Traffic data shows when visitors actually arrive, not when you assume they do. If a meaningful number of visits occur in the 30 minutes before opening or after closing, adjusting hours captures incremental revenue with minimal cost.
Network benchmarking. Comparing foot traffic across your own store fleet, normalised for market size and location type, identifies which stores are outperforming their context and which are underperforming. The outperformers offer lessons. The underperformers need investigation.
Real estate: select, negotiate, optimise
Real estate decisions are high-stakes and long-duration. A 10-year lease on the wrong location is an expensive mistake. Foot traffic data reduces that risk by grounding site evaluation in observed behaviour rather than intuition or broker narratives.
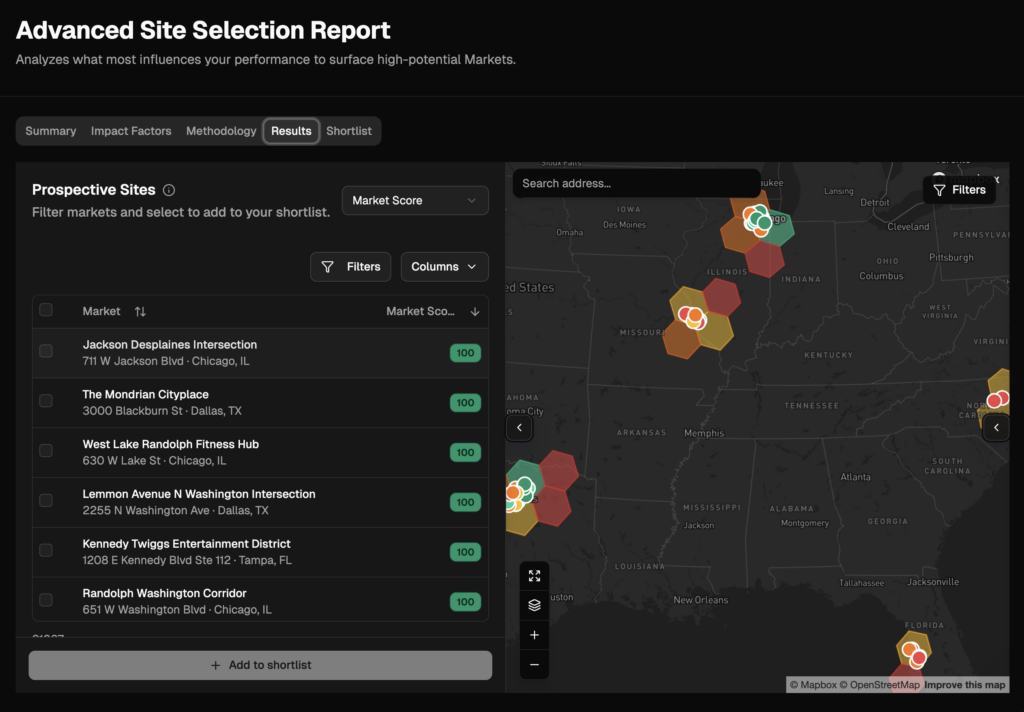
Site selection. Before committing to a location, real estate teams use foot traffic data to answer: How many visits does this site get? Is traffic trending up or down? Who are the visitors? How far do they travel? How does this compare to our best-performing locations?
Lease negotiation. Traffic data provides objective evidence for rent discussions. If a mall is asking premium rent but traffic has declined 15% over two years, that is a data point that changes the conversation. Conversely, if a location’s traffic is growing faster than the market, it may justify a premium.
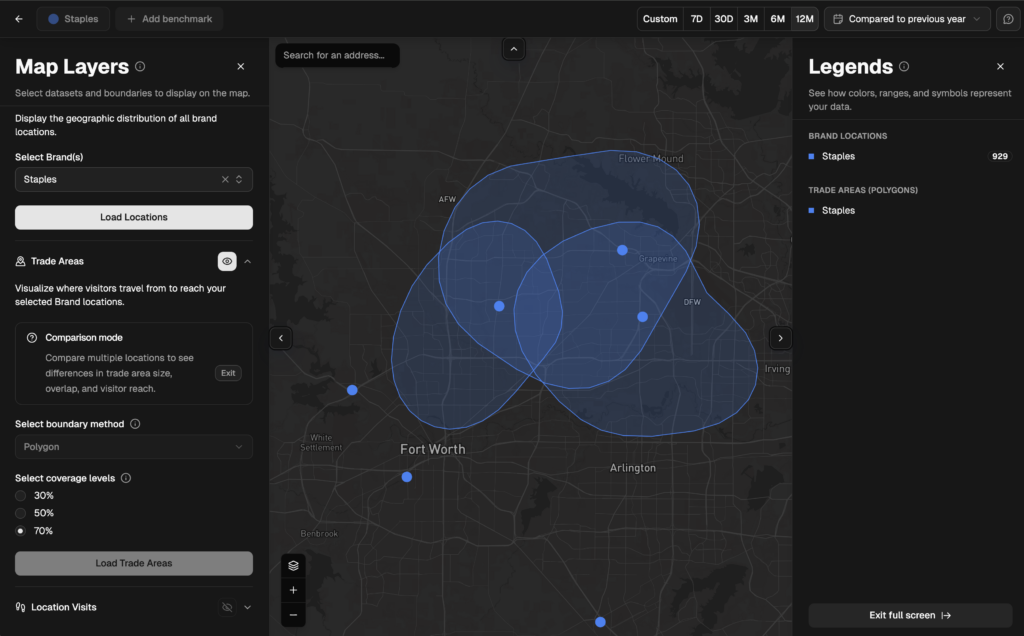
Cannibalisation analysis. When considering a new location, understanding the overlap between its trade area and your existing stores prevents self-competition. If 40% of a new site’s projected visitors already visit one of your other locations, the incremental value is lower than the headline traffic suggests.
Closure decisions. When evaluating which stores to close, traffic data combined with trade area analysis predicts where displaced customers will go. If most would migrate to a nearby competitor rather than to another of your stores, closing that location costs you more than the lease savings.
Marketing: measure, target, prove
Marketing teams need to connect their spend to physical-world outcomes. Foot traffic data provides that connection.
Campaign attribution. By comparing visit volumes during a campaign window against a baseline period (adjusting for seasonality and market trends), marketing teams can estimate the incremental visits driven by a specific campaign. This is particularly valuable for local marketing, where national-level brand metrics do not capture regional impact.
Audience profiling. Demographic and psychographic data about store visitors helps marketing teams understand who is actually walking through the door, which may differ from the assumed target audience. If your visitor profile skews older and higher-income than your media targeting, there is a disconnect to address.
Competitive share of voice. Tracking your share of foot traffic within a trade area, relative to competitors, over time is a physical-world equivalent of share of voice. If a competitor is gaining traffic share in your core markets, it signals a problem that may not yet be visible in your own sales data.
How finance and investment teams use foot traffic data
Foot traffic data has become a significant alternative data source for investors, hedge funds, and financial analysts seeking real-time signals on company performance ahead of earnings reports.
Earnings preview. Visit trends to publicly traded retailers provide a leading indicator of quarterly revenue before the numbers are reported. A fund tracking weekly foot traffic to a retail chain can detect acceleration or deceleration weeks before the earnings call.
Due diligence. Private equity firms evaluating retail acquisitions use foot traffic data to validate management claims about store performance, market position, and growth trajectory. The data provides an independent, third-party view that complements internal financials.
Sector analysis. Aggregating foot traffic across an entire retail category (grocery, QSR, apparel, home improvement) reveals sector-level trends in consumer behaviour. These signals are available daily or weekly, compared to government statistics that report monthly or quarterly with significant lag.
PassBy’s foot traffic data is available on financial data platforms including Exabel, providing investors with direct integration into their existing analytical workflows.
For a deeper dive into this use case, see our guide to alternative data.
Getting started with foot traffic data
There are two ways to access foot traffic analytics, and the right choice depends on how your team works.
Platform access. A self-serve analytics platform like Almanac lets teams explore foot traffic data visually, generate reports, run benchmarking analyses, and access predictive insights without needing a data engineering team. This is the right fit for most store operations, real estate, and marketing teams who need answers quickly and want to explore the data interactively.
Data feeds and API. For teams that want to integrate foot traffic data into their own models, dashboards, or data warehouses, raw data delivery via API or cloud feeds (Snowflake, AWS, GCP) provides maximum flexibility. This is the typical approach for finance teams, data science groups, and enterprise retailers with centralised analytics functions.
Most organisations start with platform access to validate the data and build internal use cases, then add API access as foot traffic data becomes embedded in their decision-making workflows.
See how Almanac works for your brand. Book a 15-minute walkthrough →
FAQ
What is foot traffic data? Foot traffic data is a collection of datasets describing how people visit physical locations. It includes visit counts, visitor demographics, trade area analysis, competitive benchmarking, and predictive forecasts. It is used by retailers, real estate teams, and investors to make location-based decisions.
How accurate is foot traffic data? Accuracy varies significantly by provider. PassBy achieves 94% correlation to ground truth by validating against in-store sensors, sales data, and other independent sources across hundreds of thousands of locations. Always ask a provider how they validate and what their stated accuracy means.
How much does foot traffic data cost? Pricing depends on the scope of data you need (number of locations, historical depth, whether you need API access), the provider, and your contract terms. Most providers offer tiered pricing. Contact our team for details on PassBy pricing.
What is the best foot traffic data provider? The best provider depends on your use case. For retail operations, real estate, and marketing teams who need validated, accurate data with predictive capabilities and a self-serve platform, PassBy is purpose-built for that. For a full comparison, see our guide to foot traffic data providers and our Placer.ai alternatives comparison.
Can I get foot traffic data for free? Some free sources exist (Google Popular Times, government datasets, manual counting) but they lack the accuracy, historical depth, competitive coverage, and predictive capabilities that professional use cases require. See our guide to free foot traffic data for a full breakdown.
What is the difference between foot traffic data and location data? Location data is the raw signal (a device was at these coordinates at this time). Foot traffic data is the analytical output built on top of location data: this location received this many visits, from these types of visitors, with this trend over time. Foot traffic data is location data that has been cleaned, modelled, validated, and made useful.