


If you are researching foot traffic data for the first time, the natural starting point is finding out what you can get for free. It is a reasonable instinct. Before committing budget to a data platform, you want to understand what is out there and whether it is enough for what you need.
The short answer: free foot traffic data exists, but it has specific limitations that make it unsuitable for most professional use cases. This is not a sales pitch dressed as an article. We will walk through every meaningful free source, explain exactly what it gives you and what it does not, and help you determine whether free data is sufficient for your situation or whether the gaps matter enough to warrant paying for a platform.
Google Business Profile insights
If you operate physical stores and have claimed your Google Business Profile listings, Google provides basic traffic metrics at no cost.
What you get: Search queries that led people to your listing, the number of people who requested directions to your location, phone calls initiated from the listing, and a general indicator of how busy your location is at different times (“Popular Times”). Google also shows how your listing’s photo views compare to similar businesses.
What you don’t get: Actual visit counts. Google’s “Popular Times” shows relative busyness (a bar chart of how busy a location typically is by hour) but does not give you a number. You cannot see 3,200 people visited on Saturday. You see “busier than usual.” There is no historical trend data beyond a few weeks, no competitive benchmarking, no trade area analysis, no demographics, and no way to export the data for modelling.
Useful for: Small businesses checking whether their listing is driving awareness. Not useful for any decision that requires actual numbers, historical trends, or comparisons across locations.
Google Maps Popular Times

Available to anyone, not just business owners. Search for a location on Google Maps and you can see the “Popular Times” chart showing relative busyness by hour and day.
What you get: A visual indicator of when a location is typically busiest. For some locations, Google also shows live busyness (“currently busier than usual”). This is useful for getting a rough sense of a location’s traffic patterns before visiting in person.
What you don’t get: This is directional, not quantitative. The bars show relative busyness compared to that location’s own baseline, not absolute visitor numbers. You cannot compare two locations meaningfully because a “busy” Starbucks and a “busy” furniture store have completely different visitor volumes. There is no data export, no API, no historical archive, and no way to systematically analyse multiple locations.
Useful for: Quick, informal checks before a site visit. A real estate analyst might glance at Popular Times to get a feel for a location’s rhythm, but would never base a site selection decision on it.
US Census Bureau data
The Census Bureau publishes extensive demographic and economic data at the census block group level, which can serve as a proxy for understanding the population characteristics of an area where a store is located or being considered.
What you get: Detailed demographics: population counts, age distribution, household income, education levels, employment statistics, housing characteristics, commuting patterns. All free to download and use. The American Community Survey (ACS) provides 1-year and 5-year estimates updated annually.
What you don’t get: Foot traffic. Census data tells you who lives in an area, not who visits it. A retail location’s customer base often extends well beyond the surrounding residential population. People commute, travel, and cross-shop, and none of that is captured by census data alone. Census data is also released with significant lag (1-2 years) and at geographic boundaries that may not align with your trade area.
Useful for: Understanding the demographic composition of a market as one input into a broader analysis. Census data is a necessary complement to foot traffic data, not a substitute for it. Many paid platforms (including PassBy) overlay census demographics on top of visit data to create a richer picture.
PassBy Test & Learn
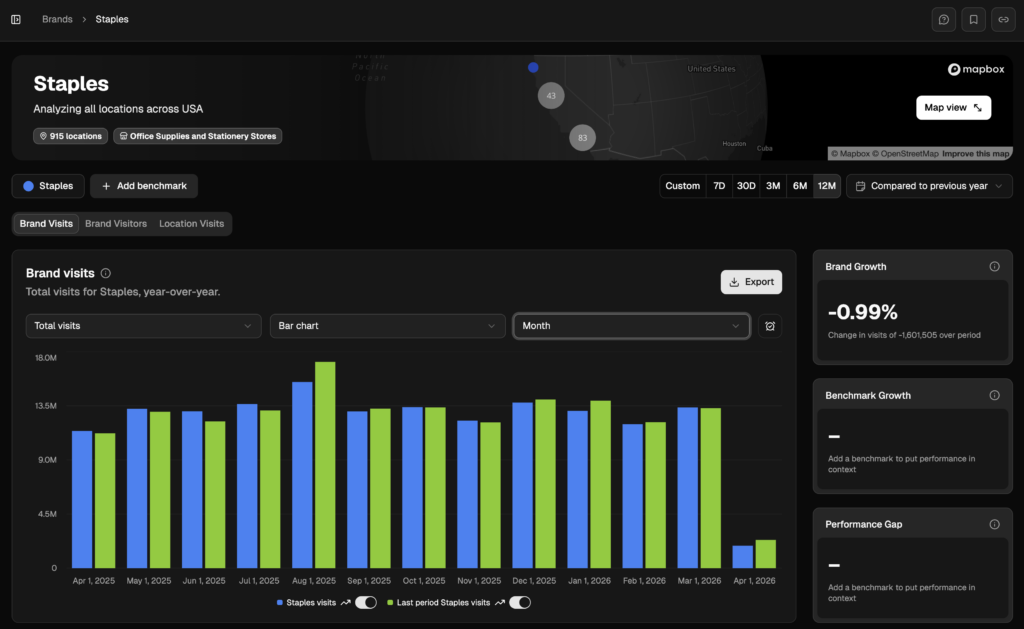
If you want to try professional-grade foot traffic data before committing to an annual plan, PassBy offers a Test & Learn tier that gives you 60 days of access to Almanac at an affordable price point.
What you get: Access to PassBy’s Almanac platform for three months, including foot traffic data, competitive benchmarking, and market intelligence for US retail locations. This is not a stripped-down demo. It is the actual platform with real data, so you can run genuine analyses, build internal use cases, and validate the data against what you already know about your stores and markets.
What you don’t get: The Test & Learn tier is designed as a starting point, not a permanent solution. Some advanced features and the full depth of data access available on Premium and Ultimate plans are not included. But unlike free tools from other providers that restrict you to surface-level data, the Test & Learn tier gives you enough depth to make real decisions and prove value internally.
Useful for: Teams that know they need foot traffic data but want to test it within their own workflow before scaling up. The 60-day window is long enough to run a proper evaluation across different use cases (site selection, performance benchmarking, campaign measurement) rather than making a snap judgement from a 30-minute demo. Learn more about Test & Learn →
Government and municipal data
Some cities and Business Improvement Districts (BIDs) publish pedestrian count data from sensors installed on sidewalks and public spaces.
What you get: Pedestrian volume counts for specific public locations, typically updated daily or hourly. Cities like New York, Melbourne, and London have open datasets showing how many people walk past certain points. Some transit authorities also publish station entry/exit data that can serve as a proxy for area foot traffic.
What you don’t get: Coverage is limited to the specific locations where sensors are installed, which is a tiny fraction of any city. The data measures pedestrians on a sidewalk, not visitors to a specific store. There is no connection between “5,000 people walked past this corner” and “how many of them entered the shop on that corner.” No demographics, no trade areas, no competitive context.
Useful for: Urban planning research and getting a rough sense of pedestrian density in a specific corridor. Occasionally useful as one data point in a site evaluation, but not actionable on its own.
Manual counting
You can always stand outside a location and count people yourself. This costs nothing except time.
What you get: A direct headcount for a specific period at a specific entrance. If you count for two hours on a Saturday afternoon, you know exactly how many people entered during those two hours.
What you don’t get: Anything beyond that snapshot. No context on whether that count is high or low relative to competitors, no trend data, no demographics, no understanding of where those visitors came from. You also cannot count at locations you do not have access to (competitor stores, sites in other cities you are evaluating remotely). And the time cost is significant: counting one location for one day tells you very little about its weekly or seasonal patterns.
Useful for: Validating data from other sources. Some real estate analysts will do a manual count during a site visit and compare it against what their data platform shows. If the numbers are in the same ballpark, it builds confidence in the platform’s accuracy. As a primary data source, it is impractical for any analysis beyond a single-location spot check.
Where free data falls short
The limitations of free sources cluster around the same gaps:
No competitive visibility. Every free method gives you data about one location at a time (if that). Professional retail decisions almost always require comparing your performance against competitors, benchmarking against the market, and understanding relative share. Free data cannot do this.
No trade area analysis. Understanding where visitors come from, how far they travel, and what other locations they visit requires mobile location data at scale. Free sources provide none of this.
No historical depth. Identifying trends, understanding seasonality, and backtesting models requires years of consistent historical data. Free sources offer days or weeks at best.
No predictive capability. Planning staffing, inventory, and marketing timing based on what is likely to happen next requires forward-looking models. Free data is backward-looking or real-time at best.
No integration. Free sources cannot be piped into your BI tools, data warehouse, or internal models. They are standalone, manual, and not designed for systematic use.
No consistency. Each free source uses a different methodology, covers different locations, and reports at different granularity. Combining them into a coherent picture is a data engineering project in itself, and the output still will not match the coverage and consistency of a purpose-built platform.
When free data is enough
Free data is genuinely sufficient in a few specific scenarios:
You are a small business with a single location and you just want to know when your busiest hours are. Google Business Profile insights and Popular Times will give you that.
You are an academic researcher studying urban pedestrian patterns and government sensor data at the neighbourhood level is the appropriate unit of analysis.
You are early in your research and want to understand what foot traffic data looks like before committing to an annual plan. PassBy’s Test & Learn tier gives you 60 days of real platform access at an affordable price to run a proper evaluation. Learn more →
When you need to pay
If any of the following describe your situation, free data will not get you there:
You are evaluating a potential store location and need to understand the site’s traffic volume, visitor profile, trade area, and competitive context before signing a lease.
You are managing a portfolio of stores and need to benchmark performance across locations, identify underperformers, and allocate resources based on traffic patterns.
You are measuring the physical-world impact of marketing campaigns and need before/after visit data with competitor controls.
You are building financial models that use foot traffic as an alternative data signal and need daily-updated, historically deep, validated data for hundreds of publicly traded retailers.
You need to compare your traffic against competitors in the same trade area using a consistent methodology.
In all of these cases, the value of the decision at stake (a lease commitment, a staffing budget, a marketing allocation, an investment thesis) far exceeds the cost of accurate data. The risk of making those decisions with incomplete free data is materially higher than the cost of a platform subscription.
PassBy provides foot traffic analytics with 94% correlation to ground truth, covering millions of US locations with 5+ years of historical data and 60-day predictive feeds. Plans start with Essential and scale to Premium and Ultimate depending on your team’s needs. See pricing →
FAQ
Can I get foot traffic data for free? Yes, but with significant limitations. Google Business Profile provides basic insights for your own locations. Google Maps Popular Times shows relative busyness. Census data covers demographics but not visits. None of these free sources provide the visit counts, competitive benchmarking, trade area analysis, or predictive data that professional use cases require. If you want to test professional-grade data before committing to an annual plan, PassBy’s Test & Learn tier offers 60 days of Almanac access at an affordable entry point. Learn more →
What is the cheapest way to get foot traffic data? For a single location, manual counting is free but labour-intensive. For multiple locations with professional-grade data, PassBy’s Test & Learn tier is the most affordable way to access validated foot traffic analytics, competitive benchmarking, and market intelligence for 60 days. From there, the Essential plan provides ongoing access for teams getting started. See pricing →
Is Google foot traffic data accurate? Google’s Popular Times shows relative busyness, not absolute visitor counts, so there is no accuracy figure to evaluate in the traditional sense. It tells you “this location is busier than usual right now” but not “this location received 3,200 visits today.” For decisions that require actual numbers, you need a dedicated foot traffic data provider.
Where can I find foot traffic data for competitor stores? Free sources do not provide competitor visit data. Mobile location data platforms like PassBy model visits to any US location using aggregated device signals, which means you can see competitive traffic without needing access to the competitor’s premises. This is the primary reason teams move from free sources to paid platforms.
How much does foot traffic data cost? Costs range from free (Google tools, manual counting) to thousands per year for professional platforms. PassBy offers a Test & Learn tier (60-day trial), plus three ongoing plans: Essential, Premium, and Ultimate. The right investment depends on the scope of your data needs and the value of the decisions the data supports. See pricing →
Can I try foot traffic data before committing to an annual plan? Yes. PassBy’s Test & Learn tier gives you 60 days of access to Almanac, the same platform used by 100+ retailers, at an affordable price. This is enough time to run real analyses, validate the data against what you already know, and build internal use cases before deciding on a longer-term plan. Start your Test & Learn →