

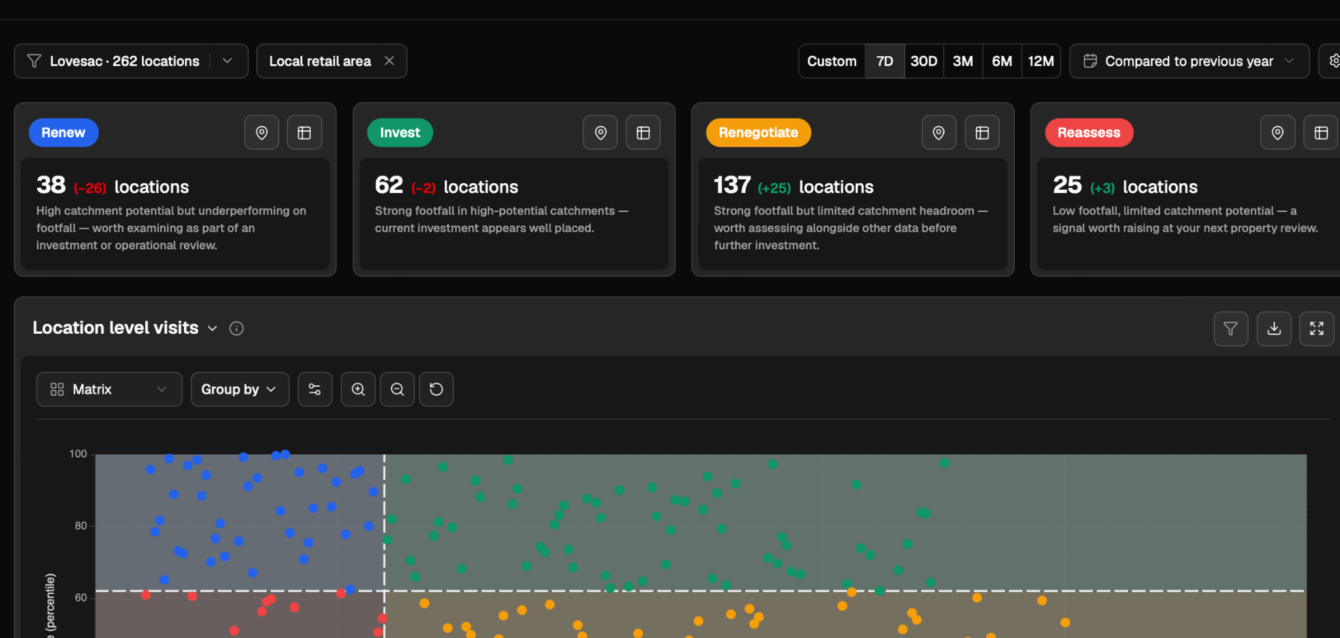
You’ve been in that Monday morning meeting when a store dips. Someone has to decide why.
A narrative wins the room, driven by whoever speaks with the most authority.
A decision is locked in: swap out the store manager, roll out a mandatory staff retraining module, and release $20,000 for local promotional signage.
This is where store operations decision making quietly breaks down. In under ten minutes, based almost entirely on narrative, internal bias, and gut feel, leadership locks in a trajectory that will cost six figures in capital, labor, and management bandwidth—all long before someone has double checked what the problem is.
Key takeaways
- Diagnosis Drives Waste: Retail operations lose millions misdiagnosing root causes, not running poor turnarounds.
- Inaction is the Highest Cost: Treating internal failures as market decline generates no invoice, but leads straight to $1.2M store closures.
- POS Data Has a Blindspot: Internal metrics show that sales dropped, but can’t reveal if the surrounding market dropped.
- Context Restores ROI: Use a market intelligence platform like PassBy to pair internal data with trade-area intelligence so leaders verify root causes before spending capital.
The true price tag of incorrect operational intervention
Every store turnaround strategy has a price. Operations teams have standard levers they can pull when a store dips, but none of them are cheap.
When an intervention is based on a flawed diagnosis, it’s not just failing to fix the store, it’s actively destroying capital.
Look at the standard playbook costs:
| Intervention Lever | Immediate Direct Cost | Operational & Hidden Cost |
| Staff Retraining | $5,000 – $15,000 | Diverted labor hours; lost floor productivity |
| Incremental Local Marketing | $10,000 – $30,000 | Immediate cash burn on unvalidated audiences |
| Manager Replacement | $15,000 – $25,000 | 3–6 month onboarding gap; store culture disruption |
| Store Remodel / Refresh | $150,000 – $400,000 | Heavy capital outlay tied up in a non-performing asset |
| Store Closure | $900,000 – $1,200,000 | Lease break penalties, severance, permanently lost market share |
Pulling any of these levers without objective market context turns routine operational expenses into a massive drain on retail operations ROI.
Type 1 vs. Type 2 errors
When diagnosing a store dip without local market data, there are two ways to get it wrong. Crucially, they are not symmetrical.
Type 1 error: Macro decline treated as execution failure
In this scenario, the local market is actually shrinking, but leadership misdiagnoses it as poor store management. You pay for the intervention—firing the manager, launching a retraining program, or buying local ads.
The decline continues anyway because the customers simply aren’t in the trade area anymore. Worse, you’ve just penalized a highly competent manager for a macro trend entirely outside of their control, triggering a culture hit and likely losing top talent.
Type 2 Error: Execution failure treated as market pressure
Here, the local market is healthy or growing, but your store is failing due to stockouts, terrible scheduling, or poor customer service.
Because internal data lacks external context, leadership writes off the dip as “a tough local market.” You do nothing. The performance gap compounds, and you silently bleed market share to the competitor across the street.
Why inaction is the biggest invisible cost
Type 2 is the expensive error, and it is entirely invisible.
Type 1 errors leave a paper trail. If you spend $25,000 replacing a manager, that shows up on a P&L. It triggers a budget review. Someone eventually has to answer for the spend.
Inaction generates no invoice.
When you write off an execution failure as market pressure, it appears in no quarterly review, no post-mortem, and no budget line. No one is held accountable because no project was launched. Yet, this compounding decay is the heaviest anchor on your retail margins.
Operational standards slip further. The best associates quit because the store feels neglected. Local brand equity rots. By the time the compounding gap becomes too massive to ignore, the store is too far gone for a $15,000 retraining initiative. You are forced into a $1.2 million closure. This invisible, silent drain is the true cost of retail misdiagnosis.
The math of guesswork: scaling to a $3.2M problem
Let’s scale this dynamic across a standard fleet to see the real financial damage.
Imagine a 500-store chain. In a typical quarter, roughly 15% of the footprint (75 stores) gets flagged for underperformance. Operations leadership commits to taking active corrective action on 40 of those stores.
Because they are diagnosing these dips using internal data without external market context, they are effectively flipping a coin. Let’s assume a 50% diagnostic failure rate. That means 20 misdiagnoses a quarter.
If we apply a blended intervention cost of $40,000 per store (mixing retraining, marketing, and manager turnover), the math is brutal:
- 20 misdiagnosed stores × $40,000 = $800,000 wasted per quarter.
- Annual waste = ~$3.2 Million per year.
And remember: that $3.2 million only accounts for the active, out-of-pocket costs of Type 1 errors. It does not include the unquantifiable compounding revenue loss of Type 2 errors, the cost of manager attrition, or the sheer waste of corporate bandwidth.
Eliminate diagnostic guesswork with PassBy
Stopping multi-million-dollar misdiagnoses doesn’t require rebuilding your data stack. The PassBy Almanac platform gives store operations leaders total portfolio clarity by pairing internal performance data with real-time trade-area intelligence.
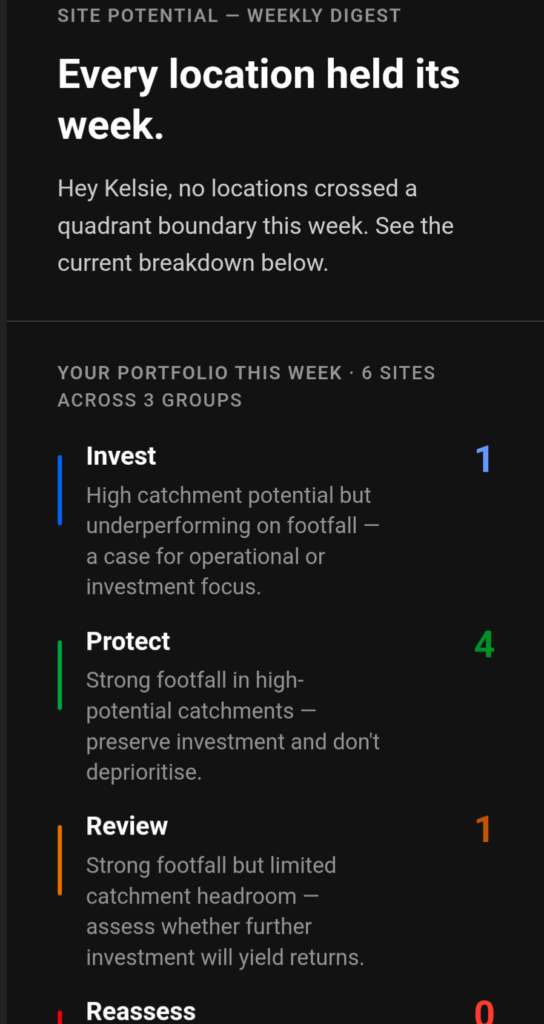
With PassBy Almanac, operations teams can:
- Benchmark Your Entire Footprint: Upload your store portfolio and immediately isolate true execution failures from broader trade-area contractions.
- Automate Early-Warning Alerts: Receive regular performance updates that flag underperforming stores before quarterly reviews—giving regional team time to pivot.
- Ask Questions in Plain English with Otto: Tap into Otto, your built-in AI analyst agent, to instantly get root-cause answers. Ask Otto: “Is Store #241 losing foot traffic to the trade area or to local competitors?” and receive executive-ready insights in seconds.
- Drive Actionable Decisions with Co-Pilot: Access hyper-local store data through Co-Pilot, empowering Regional Directors with the exact market context needed to stop pulling $40,000 diagnostic levers blindly.
Stop fixing the wrong problem. Request an Almanac demo.
Breaking the internal data trap
The fundamental reason store operations teams misdiagnose performance dips isn’t a lack of effort. It’s a lack of the right data.
Internal data is exceptional at telling you that a store is down. Your POS system, foot traffic counters, and labor models will perfectly document a 14% drop in revenue. But internal data cannot tell you whether the surrounding market is down.
- If your store is down 14% while the surrounding trade area is down 22%, your store team is actually outperforming the market.
- If your store is down 14% while the trade area is up 6%, you have an acute execution crisis that demands immediate intervention.
Unlocking operational ROI doesn’t require cheaper interventions or harder-working store managers. It requires diagnosing the root cause with precision before allocating capital.
Transform how your operations team evaluates store performance on Monday mornings.
- Portfolio Analysis: Instant market-relative benchmarking across all locations.
- AI Analytics with Otto: Ask plain-language questions, get instant root-cause diagnostics.
- Operational Co-Pilot: Real-time trade-area context for every store manager and regional director.
👉 Explore PassBy Almanac | 💬 Schedule a Demo
Explore trade area intelligence solutions
- Store Operations & Benchmarking: Measure your store performance against surrounding trade-area traffic.
Startup - Almanac Platform: Access real-world, AI-driven mobility data across 7,000+ U.S. retail brands.
- Footprint Optimization & Site Selection: Evaluate trade areas before making million-dollar closure or expansion decisions.
Frequently Asked Questions
What is the most expensive mistake when diagnosing an underperforming retail store?
The most expensive mistake is a Type 2 error: mistaking a store-level execution failure for broader market decline. Because this error results in doing nothing, it generates no invoice, triggers no budget audit, and appears on no P&L.
However, the hidden cost is massive. While leadership assumes the local market is down, operational standards slip, customer churn compounds, and competitors capture market share. This silent decay often leads to an avoidable $1.2M store closure for a location that could have been saved.
Why is internal POS and foot-traffic data insufficient for diagnosing store performance?
Internal POS, labor models, and store traffic sensors only measure output—they tell you that a store is down, but not why. If a store’s revenue drops 14%, internal data cannot clarify whether the local trade area dropped 20% (meaning the store is actually outperforming its market) or grew 5% (meaning an acute internal failure exists). Without external trade-area context, diagnostic decisions default to internal bias, authority, and guesswork.
How does trade-area intelligence improve retail store operations ROI?
Trade-area location intelligence benchmarks individual store foot traffic against real-time, external local market trends. By isolating micro-location shifts from store-level execution issues, operations teams avoid deploying costly, misaligned interventions—such as spending $25,000 to replace a store manager or $30,000 on local marketing when the trade area itself is shrinking. Preventing misdiagnoses across a retail fleet saves millions annually in direct intervention waste and protected margin.