


The typical retail customer persona is a work of fiction. It has a name (usually something like “Suburban Sarah” or “Active Alex”), a stock photo, a fictional salary, and a paragraph of backstory that reads like a dating profile. It gets presented once at a strategy meeting, emailed to the team as a PDF, and never referenced again.
The problem is not the concept. Understanding who your customers are and what drives their behavior is fundamental to every retail decision — from where to open stores to how to staff them. The problem is the method. When personas are built from assumptions, workshop brainstorms, and a handful of customer interviews, they reflect what the team believes about their customers, not what the data shows.
This guide covers how to build retail customer personas from actual data — foot traffic patterns, visitor demographics, spending behavior, and cross-shopping data — so the resulting profiles predict store performance rather than decorating a slide deck.
If you need the broader framework on customer segmentation methods, start with our pillar guide. If you want the definitional overview of what a customer profile is, start there. This guide is the practical layer — how to build the personas and use them.
Why most retail personas fail
Before building better personas, it is worth understanding why the traditional approach produces profiles that nobody uses.
They are built from the wrong inputs
Most persona creation guides recommend surveys, focus groups, and stakeholder interviews. These methods tell you what customers say they do, which is different from what they actually do. A customer who tells you she shops at your store “every week for the main grocery run” may actually visit every 10 days, spend 22 minutes per visit, and do a top-up at a competitor in between. Visitation data reveals the real behavior. Surveys reveal the customer’s narrative about their behavior.
They are too generic to be useful
A persona that says “Sarah is a 38-year-old mother of two who lives in the suburbs and values quality” describes millions of people. It does not help the real estate team decide between two sites, the marketing team choose between two campaign concepts, or the merchandising team adjust the product mix. Useful personas are specific enough that different locations have different dominant personas — and those differences drive different decisions.
They are never validated
The most damaging flaw: traditional personas are never tested against store performance. If your “high-value family” persona supposedly drives your best stores, but nobody has checked whether stores with more of that persona actually perform better, the persona is an opinion, not a tool.
What a data-driven retail persona looks like
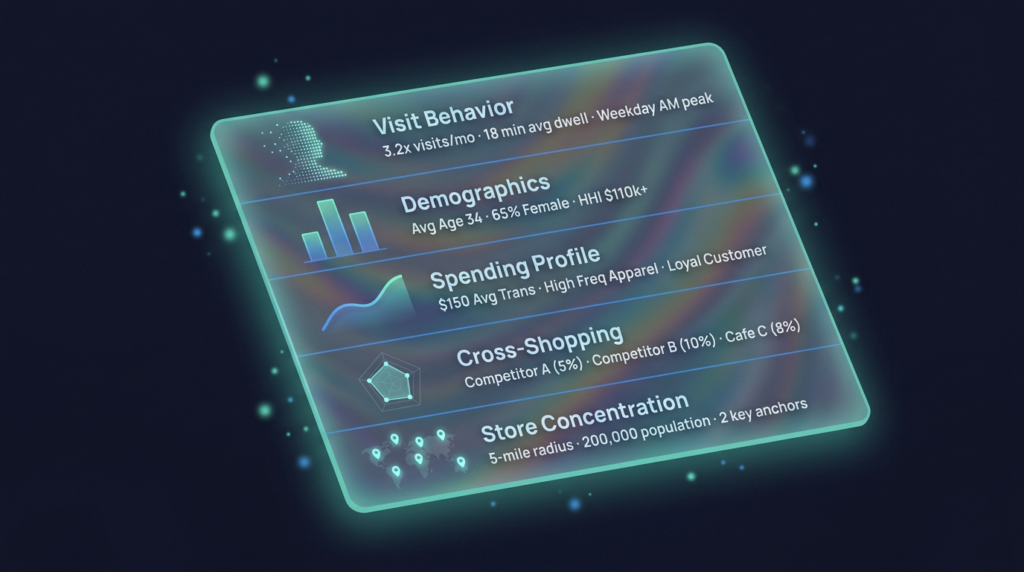
A data-driven persona replaces assumptions with observed metrics. Here is the framework:
The persona card
Each persona should include these data-backed dimensions:
Visit behavior
- Average visit frequency (visits per month)
- Typical dwell time
- Peak daypart (morning, midday, afternoon, evening)
- Weekday vs. weekend split
- Seasonal variation
Demographics
- Age range (not a single number — ranges are more honest)
- Household income bracket
- Household composition (singles, couples, families with children, empty nesters)
- Education level
- Urban/suburban/rural classification
Spending profile
- Average transaction value at your stores
- Category preferences (what they buy most)
- Share of wallet (what percentage of their category spending goes to you vs. competitors)
- Spend trend (increasing, stable, declining)
Cross-shopping behavior
- Top 5 other retail brands this persona visits (from cross-visitation data)
- Competitor visit frequency (how often they shop at direct competitors)
- Complementary visits (gym before grocery, coffee shop after pharmacy)
Store concentration
- Which of your locations this persona over-indexes at
- Which locations this persona is underrepresented at
- Geographic distribution (are they concentrated in certain markets?)
How this differs from traditional personas
| Dimension | Traditional approach | Data-driven approach |
|---|---|---|
| Visit frequency | Assumed (“shops weekly”) | Measured from foot traffic data (visits 3.2x/month, avg 18-min dwell) |
| Demographics | Guessed or surveyed | Derived from visitor-level demographics via PassBy Almanac |
| Spending | Estimated from surveys | Measured from card transaction data |
| Cross-shopping | Unknown or vague (“also shops at Target”) | Quantified from cross-visitation analysis (28% also visit Trader Joe’s, 15% visit Costco) |
| Store assignment | All stores treated the same | Personas mapped to specific locations with concentration indexes |
| Validation | None | Back-tested against store revenue, traffic, and customer satisfaction metrics |
Building personas from real data: the five-step process
Step 1: Pull your location-level data
Start with the data, not the whiteboard. For each location in your portfolio, pull:
- Visitor demographics — age, income, household composition from PassBy’s Almanac
- Visit patterns — frequency, daypart distribution, dwell time, weekday/weekend split
- Spend data — transaction values, category mix, spending trends
- Cross-visitation — where else your visitors shop
This data exists at the location level, which is critical. A single national dataset produces a single averaged persona that actually represents nobody. Location-level data produces personas that reflect the real variation across your fleet.

Step 2: Cluster the data into segments
With location-level data in hand, look for natural groupings. Statistical clustering (k-means, hierarchical clustering) works well here, but even a structured manual analysis can identify clear patterns.
You are looking for groups of visitors who share:
- Similar demographic profiles
- Similar visit behaviors (frequency, daypart, dwell)
- Similar spending patterns
- Similar cross-shopping behaviors
Three to five personas is the right number for most retailers. Fewer than three means you are missing meaningful differences. More than five creates complexity that operational teams cannot execute against.
Step 3: Validate against store performance
This is the step that separates useful personas from decorative ones. For each persona, check:
- Revenue correlation. Do stores with a higher concentration of Persona A actually generate more revenue per square foot? If your “premium wellness” persona is supposedly your highest-value customer but stores where that persona dominates do not outperform, the persona either is not well-defined or is not actually your most valuable segment.
- Traffic quality. Do stores dominated by different personas show different conversion rates, different basket sizes, different visit frequencies?
- Competitive dynamics. Do persona concentrations predict competitive vulnerability? If stores where Persona B dominates also show high competitor visitation rates, that persona may be at risk of defection.
If the personas do not correlate with any performance metric, go back to Step 2 and re-cluster. The goal is not to create interesting profiles — the goal is to create profiles that predict outcomes.
Step 4: Build the persona cards
Once validated, build the full persona card for each segment. Include:
- A descriptive name that is memorable but not condescending. “Weekday Professional” is fine. “Ambitious Alex the Avocado-Eating Achiever” is not.
- All quantified dimensions listed in the framework above
- The store-level concentration map showing which locations this persona dominates
- The key differences between this persona and the others (what makes Persona A different from Persona B in ways that matter)
Step 5: Map personas to decisions
Each persona must connect to at least one decision that a team makes. If it does not, it is interesting but not useful.
| Team | Decision the persona informs | Example |
|---|---|---|
| Real estate | Site scoring and selection | “This candidate site’s trade area has a 68% concentration of our highest-value persona — above the fleet average of 52%” |
| Marketing | Campaign targeting and creative | “Stores 12, 34, and 87 are dominated by the Weekday Professional persona — shift budget to weekday morning digital out-of-home in those markets” |
| Merchandising | Assortment and planogram | “Stores with high Weekend Family concentration should expand the family-size product range by 15%” |
| Store ops | Staffing and service model | “Stores dominated by the Evening Browser persona should maintain full staffing through 8pm, not start winding down at 6pm” |
| Finance | Portfolio optimization | “Locations where our target personas are declining quarter-over-quarter may need format changes or marketing intervention” |
How each team uses personas
Real estate and site selection
Personas transform site selection from “does this trade area have enough people?” to “does this trade area have enough of the right people?”
When you have validated personas with known performance correlations, the site selection process gets sharper. Instead of scoring a site on total foot traffic and aggregate demographics, you can estimate the persona mix at the candidate location and project performance based on how similar mixes perform at existing stores.
PassBy’s Almanac provides the visitor demographics, psychographic segments, and cross-visitation data for any location in its database — including locations you do not yet operate. This means you can profile the visitors at a candidate site (or at the competing stores nearby) before you sign a lease. For the full scoring framework, see our site selection criteria checklist.
This also strengthens cannibalization analysis. If the candidate site’s trade area draws primarily from Persona B but your nearby existing store draws from Persona A, the risk of cannibalization is lower than the geographic overlap alone would suggest.
See how Almanac supports persona-based site selection →
Marketing
Personas turn a single national marketing strategy into a portfolio of targeted approaches.
Local campaign targeting. If Store 42 is dominated by the “Weekday Professional” persona (high visit frequency, weekday morning peaks, higher-income, cross-shops at premium coffee and fitness brands), the local campaign should target weekday commute hours on channels that reach professional audiences. Store 87, dominated by the “Weekend Family” persona, gets a different creative, different channel mix, and different daypart emphasis.
Co-marketing and partnerships. Cross-shopping data within each persona reveals partnership opportunities. If your highest-value persona also over-indexes for visits to a specific fitness brand, hotel chain, or restaurant group, those are natural co-marketing candidates. This is also where retail media network decisions become more precise — you can match your persona data against the audience profiles of available RMN inventory.
Conquest marketing. If visitation data shows that a specific persona visits your competitor at 2x the rate they visit you, that persona represents a conquest opportunity. The cross-shopping data tells you which competitor to target, and the persona profile tells you how to message.
Store operations
Staffing optimization. Different personas visit at different times and require different service levels. A store dominated by the “Mission-Driven Shopper” (knows what they want, in and out in 12 minutes) needs efficient checkout and good wayfinding. A store dominated by the “Considered Buyer” (longer dwell time, more questions, higher transaction value) needs knowledgeable floor staff and consultation space.
Service model design. Persona data shapes the physical store experience. If the dominant persona cross-shops at premium brands and has high household income, the service expectations are different than a store where the dominant persona is value-oriented and time-compressed.
Daypart management. When you know which persona dominates each daypart, you can adjust the in-store experience accordingly. Morning professionals get speed and efficiency. Weekend families get engaging displays and wider aisles.
The “who visits” vs. “who lives nearby” distinction
This distinction is the single biggest upgrade you can make to your persona accuracy, and it runs through every section above.
Traditional persona building starts with census demographics for the trade area around a store. That data tells you about the resident population — who lives within driving distance. But in most retail settings, the people who live nearby and the people who actually visit are different populations.
A suburban shopping center may draw 40% of its visitors from outside the traditional catchment area. An urban store near a transit hub may be visited by commuters who live 30 minutes away but work nearby. A destination retailer may draw from a trade area three times larger than a convenience-oriented store in the same center.
Census-based personas describe the neighborhood. Visitation-based personas describe the customers. For site selection, marketing targeting, and store operations, the customers are what matter.
PassBy’s Almanac provides visitor-level demographics for every location — derived from actual visitation patterns, not census projections. This means your personas are built on who walks through the door, not who lives on the surrounding streets. For the full customer segmentation methodology, see our pillar guide.
How to keep personas current
Personas are not a one-time project. Customer behavior shifts — new competitors open, remote work patterns change commute routes, demographics evolve as neighborhoods gentrify or age.
Quarterly refresh. Pull updated visitation and demographic data each quarter and check whether the persona concentrations at each store have shifted. If Persona A has declined 15% at a cluster of stores over six months, something has changed — a new competitor, a demographic shift, or a change in the brand’s appeal to that segment.
Post-campaign validation. After a major campaign, check whether the targeted persona’s visit frequency and spend actually changed. If you ran a conquest campaign targeting Persona B, did that persona’s share of visits at targeted stores increase?
New market calibration. When entering a new market, validate your personas against the local reality. A persona that drives performance in Atlanta may behave differently in Portland. Use PassBy to profile visitors at comparable stores in the new market before assuming your existing personas transfer directly.
Our Test & Learn trial provides 60 days of Almanac access to build and validate personas across your portfolio. See pricing →
Frequently asked questions
What is a retail customer persona? A retail customer persona is a data-backed profile of a distinct shopper segment that visits your stores. It includes quantified dimensions — visit frequency, demographics, spending behavior, cross-shopping patterns, and daypart preferences — rather than fictional backstories. Effective personas are validated against store performance and used to drive decisions across real estate, marketing, and operations.
How many personas should a retailer create? Three to five personas is the optimal range for most retailers. This is enough to capture meaningful differences in customer behavior while remaining manageable for operational teams to execute against. The right number depends on how much variation exists across your store fleet — retailers with highly diverse locations (urban, suburban, resort) may need closer to five. Retailers with a homogeneous fleet may only need three. See our customer segmentation guide for the full methodology.
What is the difference between a customer persona and a customer segment? A segment is a group of customers identified through data analysis — they share measurable characteristics. A persona is the detailed profile of that segment, described in terms that operational teams can act on. The segment is the “what” (the data grouping). The persona is the “so what” (the description that drives strategy). Both are outputs of the customer segmentation process.
How do you validate a customer persona? Test whether the persona predicts store performance. If stores with a higher concentration of Persona A generate more revenue per square foot, higher conversion rates, or better traffic trends, the persona is predictive and useful. If persona concentrations do not correlate with any performance metric, the personas need to be redefined. PassBy’s Benchmarking Reports make this comparison straightforward.
What data do you need to build retail personas? The strongest retail personas combine: foot traffic data (visit frequency, dwell time, daypart patterns), visitor demographics (age, income, household composition), consumer spend data (transaction values, category preferences), cross-visitation data (where else your visitors shop), and psychographic segments (lifestyle classifications). Platforms like PassBy’s Almanac integrate the first four data types. Psychographic data comes from third-party providers like Esri Tapestry or Claritas PRIZM.
How often should personas be updated? Quarterly refreshes are the standard for well-run programs. Foot traffic patterns shift with competitive openings, seasonal changes, and macro trends. A persona validated in Q1 may need adjustment by Q3 if a competitor has opened nearby or if economic conditions have shifted spending patterns. At minimum, refresh annually, but the best organizations track persona concentrations monthly and flag significant shifts for investigation.