


The retail site selection software market has changed significantly over the past few years. What used to require a dedicated GIS analyst, multiple data subscriptions, and weeks of manual analysis can now be done through platforms that combine data, analytics, and visualization into a single workflow.
But the market has also become confusing. There are platforms that focus on foot traffic, platforms that focus on customer profiling, platforms that focus on GIS mapping, and platforms that try to do everything. Some charge $200 a month, others charge $100,000 a year. Some show you exactly how they score a site, others give you a number and ask you to trust it.
This guide cuts through the noise. It covers what site selection software actually does, the capabilities that separate useful platforms from expensive ones, and how the major options compare for retail real estate teams evaluating their next tool.
What site selection software does
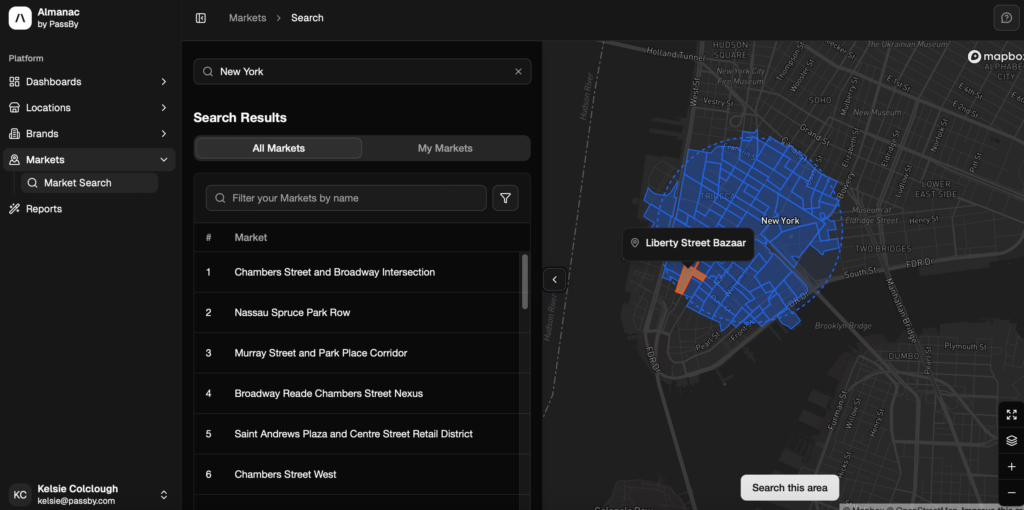
At its core, site selection software answers one question: should we open a store at this location? It answers that question by combining multiple data sources into an analysis that would take weeks to assemble manually.
The typical platform provides some combination of these capabilities:
Foot traffic analytics. How many people visit the candidate location and its surrounding area? What are the hourly, daily, and seasonal patterns? Is traffic growing or declining? This is the most direct predictor of a site’s potential and the area where data quality varies most between platforms.
Demographic and psychographic profiling. Who lives in and visits the trade area? Income, age, household composition, education, lifestyle interests, and spending behavior all inform whether the surrounding population matches your target customer.
Trade area analysis. Where do visitors come from? How far do they travel? How does the trade area compare to your existing stores’ catchments? See our trade area analysis guide for a detailed breakdown of methodology.
Competitive landscape. Who else operates nearby? How are they performing? Is the trade area underserved or saturated for your category? See competitive intelligence for more on this dimension.
Cannibalization modeling. Will the new store draw traffic from your existing locations? What percentage of its projected traffic is incremental vs transferred? See our cannibalization guide for the full framework.
Predictive scoring and forecasting. What traffic and revenue can you expect from this location? Platforms vary significantly in how they generate these projections and how transparent they are about the methodology.
Visualization and reporting. Maps, dashboards, and exportable reports that present the analysis in a format suitable for internal committees, boards, and lease negotiations.
What actually matters when evaluating platforms
Not all capabilities are equally important, and not all implementations of the same capability are equally useful. These are the dimensions that separate platforms that drive good decisions from platforms that generate expensive reports.
Data accuracy and validation
This is the single most important differentiator. A platform’s analysis is only as good as the data feeding it. The question to ask any vendor is: how do you validate your data, and against what ground truth?
Some platforms validate against a small sample of locations. Others validate broadly but don’t disclose their methodology. PassBy validates against hundreds of thousands of in-store sensors and sales data records using 15+ independent data inputs, achieving 94% correlation to ground truth. This validation rigor matters because the cost of a wrong site decision (a 10-year lease on a location that underperforms) far exceeds the cost of the software itself.
For more on why data accuracy matters, see our data accuracy guide.
Transparency of methodology
When a platform gives a location a score of 85 out of 100, do you know why? Can you interrogate the inputs, understand the weighting, and explain the score to a committee or board?
“Black box” scoring systems generate a number without showing the work. This creates two problems: you can’t catch errors in the model’s assumptions, and you can’t defend the recommendation to stakeholders who ask how you arrived at it. Look for platforms where the scoring methodology is visible and auditable.
Coverage and freshness
How many locations does the platform cover? Is coverage consistent across urban, suburban, and rural areas? How frequently is the data updated?
A platform that covers major metros well but has gaps in secondary markets will not help you evaluate sites in Boise or Knoxville. Similarly, data that updates quarterly is less useful than data that updates weekly or daily, especially when evaluating fast-changing markets.
PassBy covers 1.5 million US store locations with data updated regularly, historical depth of 5+ years, and 90-day predictive feeds. Coverage is consistent across market sizes.
Breadth of data
Does the platform provide just foot traffic, or does it also include spend data, demographics, psychographics, competitive benchmarking, and predictive forecasts? Each additional data layer reduces the number of external tools your team needs to cobble together.
The “duct tape” problem is real. Many real estate teams use one tool for traffic, another for demographics, a spreadsheet for scoring, a map app for visualization, and another spreadsheet to combine everything. A platform that integrates these layers reduces assembly time and eliminates the inconsistencies that arise from combining data from different sources and time periods.
Access methods
Different team members need different access points. Business users need a visual platform with dashboards and reports. Data teams need an API or cloud delivery to feed internal models. Some team members may prefer to query data through AI assistants rather than navigating a dashboard.
PassBy provides access through the Almanac platform (self-serve), API, cloud delivery (Snowflake, AWS, GCP), and AI assistant integrations (ChatGPT, Copilot, Gemini). For setup guidance, visit the help center.
Pricing structure
Site selection software pricing ranges from $200/month to $100,000+/year depending on the platform and plan. The key questions are: what’s included at each tier? Are there per-seat fees? Is data access metered or unlimited?
Transparent pricing makes budgeting easier. Custom pricing that requires a sales call to learn the cost creates friction for teams evaluating multiple options. PassBy offers three published tiers (Essential, Premium, Ultimate) plus a Test & Learn option for 90-day evaluation. See pricing →
How the major platforms compare
The site selection software market includes several categories of tools. Understanding which category a platform falls into helps you evaluate whether it matches your needs.
Retail market intelligence platforms
These platforms combine foot traffic, competitive benchmarking, spend data, and market analysis into a unified view of retail performance. They are designed for ongoing market intelligence, not just one-time site evaluations.
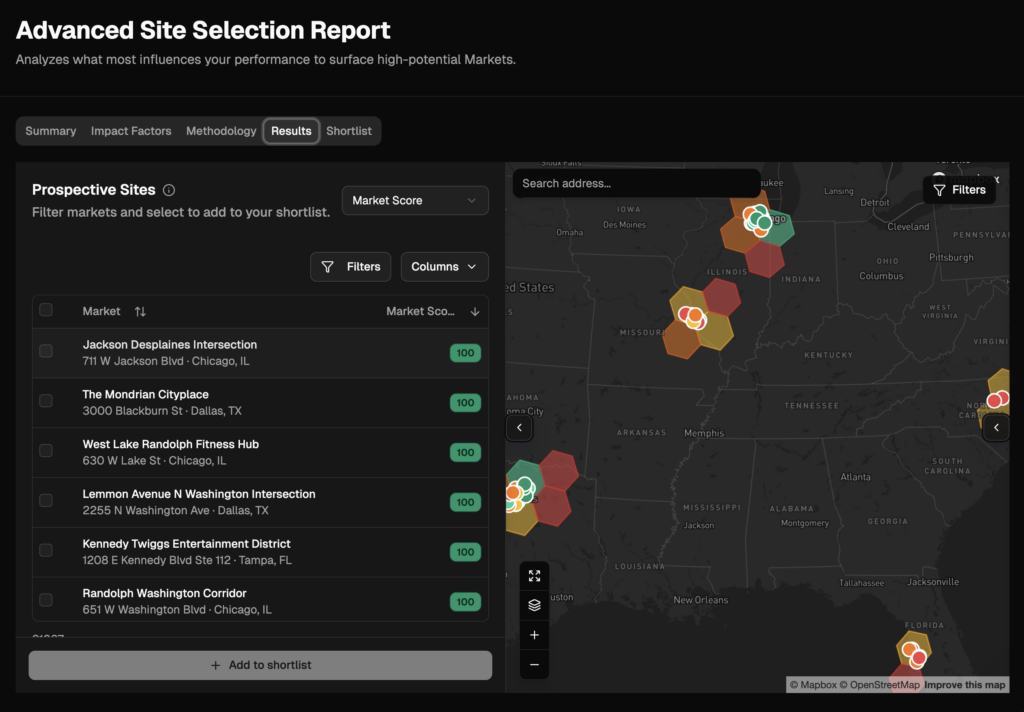
PassBy (Almanac) provides foot traffic analytics, spend data ($1 trillion indexed), competitive benchmarking, demographic and psychographic profiling, trade area analysis, and 90-day predictive feeds. Almanac’s Brands view compares brand performance across markets. The Markets view evaluates retail environments (malls, centers, clusters) as competitive arenas. Validated at 94% correlation to ground truth using 15+ data inputs. Access through platform, API, cloud delivery, and AI assistants.
Best for: Retail teams (store ops, real estate, marketing) that need ongoing market intelligence beyond one-time site selection. Teams that value data accuracy validation and want a single source for traffic, spend, and competitive data.
Placer.ai provides foot traffic analytics, demographic profiling, trade area analysis, and competitive benchmarking. Strong brand recognition and extensive content marketing. Free tier available for basic exploration. Accuracy methodology not publicly disclosed in the same detail as PassBy.
Best for: Teams that want a broad location analytics platform with a free tier to explore. Strong for CRE, dining, and civic use cases alongside retail.
For a detailed comparison, see PassBy vs Placer.ai.
Customer analytics and site scoring platforms
These platforms emphasize customer profiling, predictive scoring, and sales forecasting. They focus more on modeling who your customer is and predicting how a site will perform for your specific brand.
Buxton uses proprietary “Customer DNA” data from 200M+ consumer profiles to forecast sales potential and score sites. Strong cannibalization modeling and portfolio optimization. Trade area analysis and GIS mapping included. Enterprise-focused with significant implementation requirements.
Best for: Large retail chains and franchises that want brand-specific sales forecasting and are willing to invest in enterprise implementation.
SiteZeus uses AI and machine learning to score and rank sites based on 200+ geospatial data layers. Predictive sales forecasting, scenario modeling, and interactive mapping. Cloud-based with a focus on accessibility.
Best for: Retailers that want AI-driven site scoring with a broad data layer integration. Strong for multi-unit operators evaluating many sites simultaneously.
GIS and location intelligence platforms
These are the infrastructure-level tools that provide mapping, spatial analysis, and demographic data. They require more technical expertise but offer maximum flexibility.
Esri ArcGIS Business Analyst is the industry-standard GIS platform with extensive demographic, consumer spending, and competitive data. Powerful spatial analysis tools but requires GIS expertise. Pricing ranges from $10,000 to $100,000+ annually depending on configuration.
Best for: Teams with dedicated GIS analysts who want maximum analytical flexibility and already operate within the Esri ecosystem.
Emerging hybrid platforms
GrowthFactor combines foot traffic, demographics, competition analysis, and AI scoring into a platform with transparent “glass box” scoring. Emphasizes speed (site reports in seconds) and includes analyst support. Published pricing starting at $400/month, which is lower than most enterprise alternatives.
Best for: Growing retail chains (10-100 locations) that want data-driven site selection without enterprise pricing or implementation timelines.
How to choose the right platform
The right platform depends on three things: your team’s size and expertise, how many sites you evaluate per year, and what other tools you already use.
If you evaluate fewer than 10 sites per year and your team lacks dedicated GIS expertise, a platform with an intuitive interface and built-in analytics (PassBy, Placer.ai, GrowthFactor) will deliver more value than an enterprise GIS system.
If you evaluate 50+ sites per year and need brand-specific sales forecasting, the investment in an enterprise platform with predictive modeling (Buxton, SiteZeus) may be justified by the volume of decisions it supports.
If you already have a GIS team and Esri licenses, you may not need a separate site selection platform. Instead, you need the data feeds (foot traffic, competitive benchmarking, spend) that plug into your existing infrastructure. PassBy’s API and cloud delivery are designed for this use case.
If your needs span beyond site selection into ongoing store performance monitoring, competitive intelligence, and marketing measurement, a market intelligence platform (PassBy) provides the broadest utility across teams.
Most retail organizations end up using two tools: a market intelligence platform for data and ongoing monitoring, and either a GIS system or a scoring platform for the analytical workflow. The overlap between categories means there is no single “best” platform, only the best fit for your specific workflow and budget.
Ready to see how Almanac supports site selection alongside competitive benchmarking, marketing measurement, and portfolio optimization? Book a 15-minute walkthrough →
FAQ
What is retail site selection software? Site selection software is a technology platform that helps retail real estate teams evaluate and choose store locations using data analytics. These platforms typically combine foot traffic data, demographic profiling, competitive analysis, trade area mapping, and predictive scoring to assess a location’s potential before committing to a lease. They replace the manual process of assembling data from multiple sources into spreadsheets.
How much does site selection software cost? Pricing ranges from $200/month for basic tools to $100,000+/year for enterprise GIS platforms. PassBy offers three published tiers (Essential, Premium, Ultimate) plus a 90-day Test & Learn option. Other platforms like Buxton, SiteZeus, and Esri use custom enterprise pricing. GrowthFactor publishes pricing starting at $400/month. See PassBy pricing →
What’s the difference between site selection software and foot traffic analytics? Foot traffic analytics measures visitor volume, patterns, and demographics at a location. Site selection software uses foot traffic data as one input alongside demographics, competitive analysis, cannibalization modeling, and financial projections to evaluate whether a specific location is viable for a specific brand. Many platforms (PassBy, Placer.ai) provide both capabilities.
Do I need a GIS system for site selection? Not necessarily. Traditional GIS systems (Esri ArcGIS) offer maximum analytical flexibility but require technical expertise. Modern site selection platforms provide map-based analysis, trade area visualization, and spatial analytics through intuitive interfaces that don’t require GIS skills. For teams without a dedicated GIS analyst, a platform approach is faster to implement and easier to maintain.
How do I evaluate whether a site selection platform’s data is accurate? Ask three questions: What is your validation methodology? Against what ground truth do you validate? What is your stated accuracy metric? Platforms that can answer all three with specificity (PassBy: 94% correlation to ground truth, validated against in-store sensors and sales data, 15+ data inputs) provide more confidence than platforms that claim “high accuracy” without methodology disclosure.
Can site selection software predict cannibalization? The better platforms include cannibalization modeling that compares the projected trade area of a new site against existing stores’ observed trade areas. The percentage of overlap predicts how much of the new store’s traffic would be transferred from existing locations. See our cannibalization guide for the full methodology.