


White space analysis answers the most fundamental question in retail expansion: where should we open next?
Not “which available site should we take” — that question comes later. White space analysis operates upstream, identifying the markets, submarkets, and corridors where demand for your brand exists but supply does not. It is the difference between reacting to what brokers bring you and proactively targeting the locations where your next store has the highest probability of success.
The concept is straightforward. The execution requires data. A market has white space for your brand when three conditions are met simultaneously: the trade area contains enough of your target customers, those customers are currently underserved by your brand and direct competitors, and the economics of the location support a profitable store. Foot traffic data, demographic profiling, and competitive benchmarking are what turn that framework from theory into a ranked list of actionable expansion targets.
What white space analysis is and is not
White space analysis is a systematic method for identifying geographic markets where the gap between customer demand and current supply creates an opportunity for a new store. It maps where your target customers live, work, and shop, then identifies areas where they lack convenient access to your brand or close competitors.
White space analysis is not a list of available real estate. White space identifies the markets worth entering. Site selection identifies the specific locations within those markets. The two processes are sequential: white space first, site selection second. Running site selection without white space analysis means you are evaluating available sites without knowing whether the market itself is the right one.
White space analysis is not just looking for areas with no competitors. A market with zero competitors might have zero competitors for a reason — insufficient demand, poor demographics, or structural barriers. True white space exists where demand is present and supply is insufficient, not where both are absent.
The data that drives white space analysis
Demand mapping
The first layer is understanding where your target customers exist in sufficient density to support a store.
Demographic alignment. Using your best-performing stores as a template, define the demographic profile that predicts success for your brand: income range, age distribution, household composition, education level. Then map where that profile concentrates across the country. PassBy’s demographic data, layered on top of census data, shows not just who lives in a trade area but who visits it, capturing commuters, workers, and cross-shoppers that residential data alone misses.
Psychographic alignment. Two neighborhoods with identical income and age profiles can have completely different spending patterns. Psychographic data reveals lifestyle characteristics — fitness orientation, dining preferences, brand affinities, value-seeking behavior — that predict whether a population will respond to your brand. PassBy’s psychographic profiling is built from observed behavior patterns, making it more predictive than survey-based segments.
Existing customer geography. If you operate an e-commerce channel, your online customer data reveals where demand already exists digitally. Markets where you have strong online sales but no physical presence are natural white space candidates because the brand awareness is already established.
Supply mapping
The second layer is understanding where that demand is already being served.
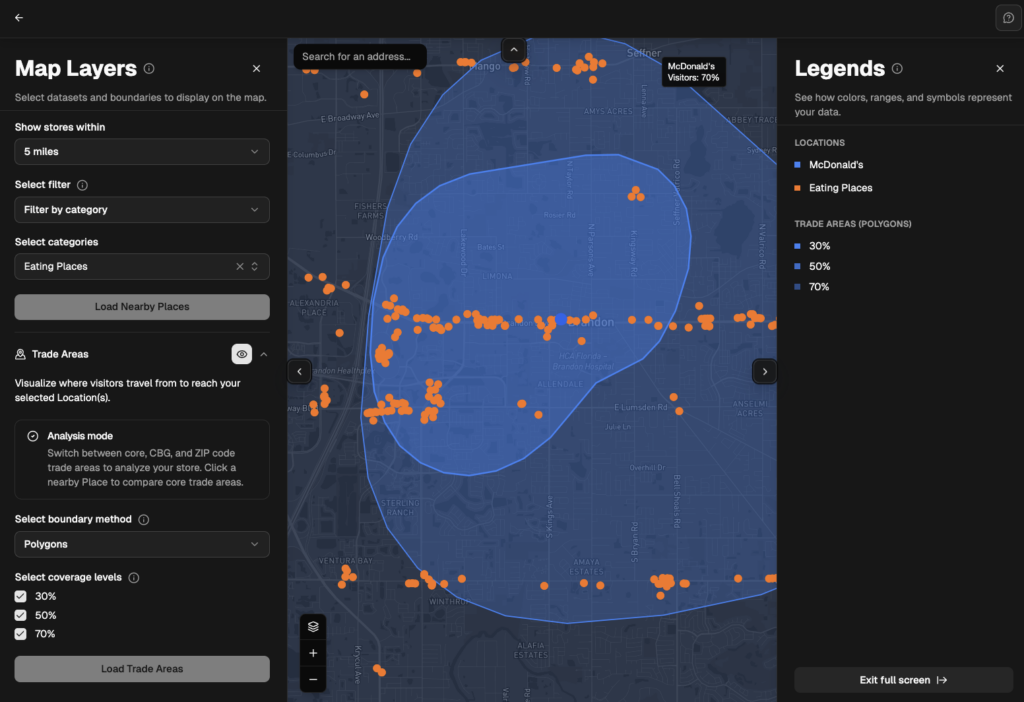
Your own store coverage. Map your existing locations and their observed trade areas. The gaps between your trade areas — geographic zones where your target customers exist but cannot conveniently reach one of your stores — are the primary white space zones.
Competitor coverage. Map competitor locations and their trade areas as well. White space where no competitor operates is the highest-value opportunity. White space where competitors are present but underperforming (declining traffic, poor demographic alignment) is the second-highest opportunity — the demand exists and the current supply is weak.
Competitive performance. PassBy’s competitive benchmarking data shows not just where competitors are located but how they are performing. A market where your closest competitor has three stores all showing declining same-store traffic tells a different story than one where the competitor has three stores all growing. The first suggests vulnerable share you can capture. The second suggests strong demand but tougher competition.
Viability filtering
Not every white space zone is a viable expansion target. The third layer filters opportunities by practical viability.
Population density and growth. A white space zone in a market losing population is a shrinking opportunity. One in a market gaining residents is an expanding one. Census projections, building permit data, and foot traffic trend data all contribute to the growth assessment.
Retail infrastructure. Does the white space zone have the physical retail infrastructure to support a new store? Available shopping centers, retail corridors, or development parcels need to exist (or be planned) for the opportunity to be actionable.
Cannibalization risk. A white space zone that is technically underserved but sits between two of your existing stores may not be true white space — opening there could cannibalize both neighboring locations. Trade area overlap analysis filters these false positives. See our cannibalization guide for the methodology.
Financial thresholds. Apply your minimum revenue and maximum rent-to-revenue criteria to filter white space zones that pass the demand and supply tests but cannot support your economics. A white space zone in Manhattan may have strong demand and no competitor, but if rent makes profitability impossible, it is not actionable white space.
How to run a white space analysis
Step 1: Define your success profile
Start with your own data. Identify your top 20% of stores by performance and analyze what their trade areas have in common: demographic composition, psychographic characteristics, competitive density, foot traffic patterns, co-tenancy, and format type. This “success profile” becomes the template for identifying white space.
Step 2: Score every market against the profile
Using PassBy’s data, score markets across the US (or your target geography) on how closely they match your success profile. Markets that score highly on demographic alignment, psychographic fit, and demand indicators but currently have no store or limited competitor presence rise to the top.
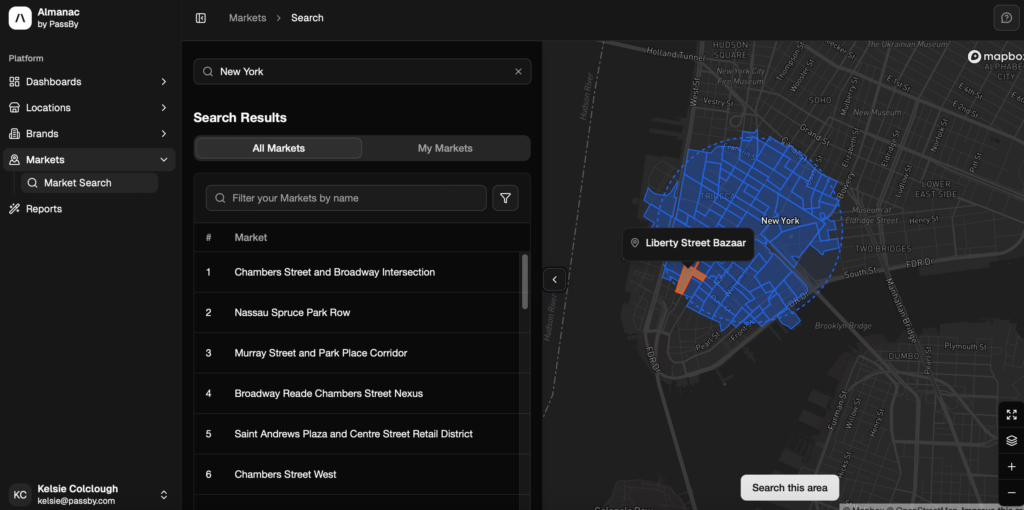
In Almanac, the Markets view analyzes retail environments (malls, centers, clusters, trade areas) and benchmarks them against comparable properties. This lets you compare white space opportunities on equal footing rather than evaluating each one in isolation. For a walkthrough, visit the help center.
Step 3: Rank by opportunity size
Not all white space is equal. Rank the identified opportunities by a composite of demand strength (how many target customers, how strong the demographic fit), supply gap (how underserved the market is), and growth trajectory (whether the market is expanding or contracting).
A market with strong demand, no competitor presence, and growing population is a higher-priority target than one with moderate demand, one weak competitor, and stable population. Both are white space. The first is better white space.
Step 4: Validate and pipeline
For the top-ranked white space markets, transition to the site selection process: identify specific available locations within the market, evaluate them against your site selection criteria, and build a pipeline of actionable opportunities.
White space analysis produces a ranked list of markets. Site selection produces a ranked list of sites within those markets. The two processes work in sequence but serve different decisions.
White space analysis by retail category
Different categories define white space differently because their trade area sizes, competitive dynamics, and customer requirements differ.
QSR and fast food. Trade areas are small (5-7 minutes), so white space can exist within a single metro. A QSR brand might have strong coverage on the north side of a city and zero presence on the south side, creating intra-metro white space. QSR white space analysis also considers commuter corridors, highway exits, and daypart traffic patterns. See restaurant site selection for the format-specific criteria.
Apparel and fashion. Trade areas are larger (15-20 minutes) and demographic alignment matters more than proximity. White space for an apparel brand is defined by psychographic fit as much as geographic gap. A premium DTC brand might have national white space in affluent suburban markets where the demographics align but no store exists. See apparel site selection for more.
Grocery. Trade areas are moderate (8-12 minutes) and population density within a tight radius is the primary demand driver. Grocery white space often appears in newly developed suburban areas where residential construction has outpaced retail development. Grocery white space analysis must also account for the anchor effect: a new grocery store changes the competitive dynamics of an entire center.
Pharmacy. Trade areas are hyperlocal (under 10 minutes). The wave of pharmacy closures by CVS, Walgreens, and Rite Aid has created temporary white space in markets where the closures left customers without a convenient pharmacy option. This displacement white space is time-sensitive — competitors will fill it if you don’t.
Common mistakes in white space analysis
Confusing “no stores” with “white space.” A market with no stores of your type may have no stores for good reason. Always verify that demand exists before concluding that supply is missing.
Ignoring competitor trajectory. A market where a competitor is growing aggressively is harder to enter than one where the competitor is declining. White space analysis should weight competitive performance, not just competitive presence.
Over-indexing on demographics alone. Demographics define the potential customer pool but do not confirm demand. Foot traffic data showing high visitation to similar brands in adjacent markets is stronger evidence of demand than demographic alignment alone.
Treating white space as static. Markets change. New residential development creates white space where none existed. Competitor closures create temporary white space. Population shifts eliminate white space that existed a year ago. White space analysis should be refreshed at least annually, and more frequently in fast-changing markets.
Skipping cannibalization checks. A zone that appears to be white space on a map may overlap significantly with an existing store’s trade area when measured by actual visitor movement data. Always run the cannibalization analysis before advancing a white space opportunity to the site selection stage.
Getting started
PassBy’s Almanac platform provides the data layers that power white space analysis: demographic and psychographic profiling, competitive benchmarking with traffic trends, trade area analysis, and cannibalization modeling. The Markets view lets you compare retail environments across geographies to identify and rank white space opportunities systematically.
For teams running their first white space analysis, the Test & Learn tier provides 90 days of Almanac access — enough time to define your success profile, screen markets, and build a ranked pipeline of expansion targets. See pricing →
FAQ
What is white space analysis in retail? White space analysis is the process of identifying geographic markets where customer demand for your brand exists but is not being adequately served by your own stores or direct competitors. It is the strategic planning step that precedes site selection, answering “which markets should we enter” before “which specific sites should we lease.”
How do you find white space for retail expansion? Define your success profile from your best-performing stores (demographics, psychographics, competitive environment). Score markets across your target geography on how closely they match that profile. Identify markets that score highly on demand indicators but have limited presence from your brand or direct competitors. Filter by viability (population growth, retail infrastructure, financial thresholds) and rank by opportunity size.
What data do you need for white space analysis? Demographic data (income, age, household composition), psychographic data (lifestyle and spending behavior), competitive data (competitor locations and performance), foot traffic data (visitor volumes and trends), trade area data (your existing stores’ catchments), and growth data (population trends, new development). PassBy provides all of these through the Almanac platform.
How is white space analysis different from site selection? White space analysis identifies which markets to enter. Site selection identifies which specific locations within those markets to lease. White space operates at the market level (metros, submarkets, corridors). Site selection operates at the property level (specific centers, streets, units). The two processes are sequential: white space first, site selection second.
How often should you run white space analysis? At minimum annually as part of strategic planning. More frequently in fast-changing markets or when significant events occur (competitor closures, new residential development, demographic shifts). Treating white space analysis as a continuous discipline rather than a one-time project ensures your expansion pipeline reflects current market conditions.