


Restaurant site selection follows different rules than general retail. A clothing store needs the right demographic profile. A restaurant needs the right people at the right time of day, traveling in the right direction, with the right amount of hunger and the right number of alternatives nearby. The variables are more dynamic, the trade areas are smaller, and the margin for error is tighter.
The cost of getting it wrong is significant. The average QSR build-out runs $500,000 to $1 million before the first customer walks in. A casual dining restaurant can exceed $2 million. A 10-year lease on a location that underperforms by 20% does not just miss its revenue target. It generates years of below-threshold returns on capital that could have been deployed at a better site.
Foot traffic data changes the restaurant site selection process because it reveals the dimension that matters most for dining concepts: when people are moving, not just how many. This guide covers what makes restaurant site selection distinct from general retail, the criteria that predict success by format, and how data turns each criterion from a judgment call into a measurement.
Why restaurant site selection is different from retail
Daypart is everything
A general retailer needs traffic throughout the day. A restaurant needs traffic during specific windows. A breakfast-focused QSR lives and dies on 6-9am traffic. A lunch-driven concept needs the 11am-1:30pm window. A casual dining restaurant needs evening traffic from 5:30-9pm.
The same location can be excellent for one format and terrible for another based entirely on when its traffic occurs. A strip center anchored by a gym might show strong morning traffic and evening traffic, making it ideal for a smoothie or health-focused fast casual concept. But if the midday traffic is minimal because the surrounding area is residential, a lunch-driven QSR would struggle there despite impressive total daily traffic numbers.
Foot traffic data broken down by hour and day of week is the single most valuable input for restaurant site selection. PassBy provides hourly visit patterns for any US location, so you can see exactly when traffic peaks and whether those peaks align with your operating model. For a walkthrough of how to access daypart data in Almanac, visit the help center.
Trade areas are smaller and direction matters
A destination retailer might draw customers from a 20-minute drive. A QSR draws from 5-7 minutes. A casual dining restaurant draws from 10-15 minutes. The trade area is not just smaller. It is more sensitive to barriers.
A highway between your restaurant and a residential neighborhood that is technically within the trade radius creates a directional barrier. A customer driving home from work will not cross a highway to pick up dinner when there is a QSR on their side of the road. Direction of traffic flow matters: a restaurant on the “going home” side of the road captures dinner traffic from commuters. The same restaurant on the “going to work” side misses that flow entirely.
PassBy’s trade area analysis builds observed catchments from actual visitor movement data rather than theoretical drive-time radii. This captures directional effects, highway barriers, and natural boundaries that circular trade areas miss.
Co-tenancy effects are format-specific
The retailers and services surrounding a restaurant affect its traffic in ways that are highly specific to the dining format.
QSR benefits from cluster effects. Fast food restaurants often perform better near other fast food restaurants. This is counterintuitive but well-documented. A cluster of QSR options creates a dining destination where customers know they will find something they want. The customer’s decision is not “should I go to this area to eat” but “which of these options do I want today.” QSR brands that deliberately locate near competitors capture share from the cluster’s combined draw.
Casual dining benefits from complementary anchors. A casual dining restaurant near a movie theater, entertainment venue, or successful retail center benefits from the pre-dinner or post-activity traffic those anchors generate. The key is that the anchor’s peak times overlap with the restaurant’s operating hours.
Fast casual benefits from office and workplace proximity. Concepts like Chipotle, Sweetgreen, and Panera Bread thrive near concentrations of office workers because their lunch model depends on weekday midday traffic. The shift to hybrid work has complicated this: a location near offices that are fully occupied five days a week has a different traffic profile than one near offices that are occupied three days.

Franchise considerations add complexity
For franchise restaurant brands, site selection has an additional dimension: the franchise territory. Each franchisee operates within a defined area, and a new location must not only perform well on its own but also avoid cannibalizing an existing franchisee’s territory.
Trade area overlap analysis is especially critical in franchise systems because the consequences of cannibalization extend beyond the brand’s own economics. A corporate-owned store that cannibalizes another corporate store is an internal optimization problem. A new franchise location that cannibalizes an existing franchisee’s revenue is a contractual and relationship problem that can lead to litigation, franchisee attrition, and reputational damage.
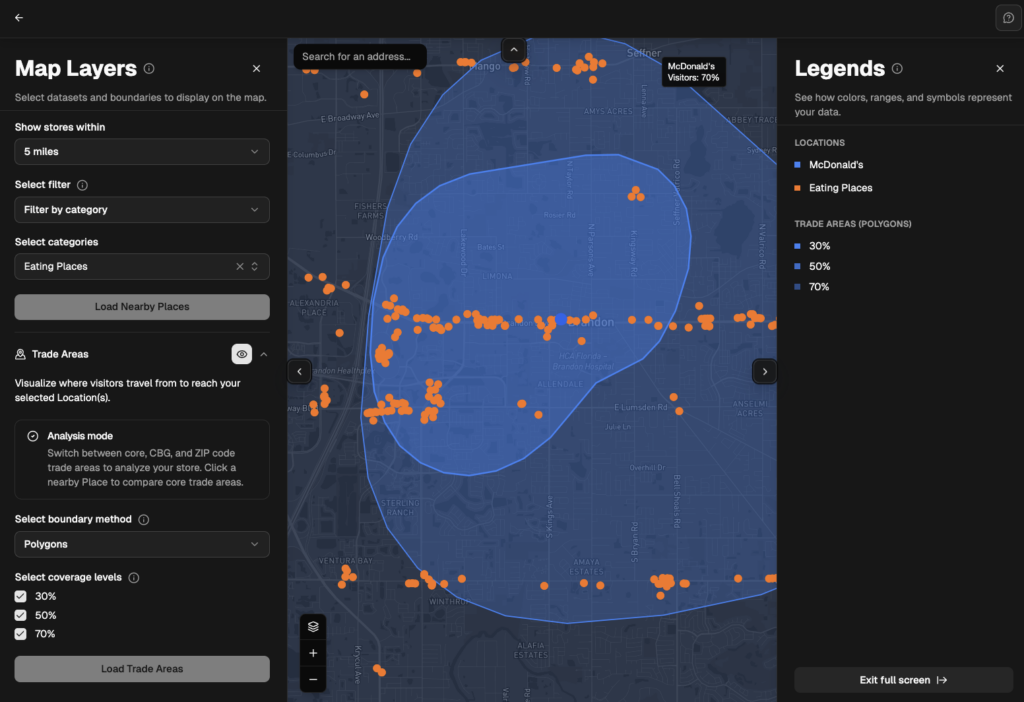
Many franchise agreements now include maximum cannibalization thresholds. PassBy’s trade area overlap analysis provides the data to enforce these thresholds objectively. See our cannibalization guide for the full methodology.
The criteria that matter by restaurant format
QSR / fast food
Traffic volume during target dayparts. The total daily traffic number is less important than traffic during the specific hours your concept operates. A location with 15,000 daily visitors but only 2,000 between 11am-1pm is weaker for a lunch QSR than a location with 8,000 daily visitors and 3,500 at lunch.
Drive-thru accessibility. For QSR concepts with drive-thru, the site must support drive-thru layout, traffic flow, and stacking capacity. A site with excellent foot traffic but no drive-thru possibility may not work for a concept where 60-70% of revenue comes through the window. Foot traffic data tells you how many people are in the area. The site visit tells you whether the physical configuration supports drive-thru.
Speed of access. QSR customers value speed and convenience above all else. A site that requires a left turn across traffic, a confusing parking lot entrance, or a long walk from the parking area to the door creates friction that QSR customers will not tolerate. They will drive to the next option.
Competitive cluster dynamics. Unlike most retail categories where competitor proximity is a risk, QSR often benefits from clustering. The analysis should focus on whether the cluster has enough traffic to support an additional concept, not whether competitors are nearby. A cluster of five QSRs on a busy corridor with strong daypart traffic can support a sixth if the total demand justifies it.
Commuter patterns. A QSR on a major commuter route captures breakfast (morning commute) and dinner (evening commute) traffic from a population that passes the site daily. The consistency of this pattern makes commuter-route QSR locations among the most predictable in the industry.
Fast casual
Weekday lunch traffic density. Fast casual concepts like Chipotle, Sweetgreen, CAVA, and Panera depend on weekday lunch traffic more than any other daypart. The critical metric is not total area traffic but the concentration of visitors between 11am-2pm on weekdays. PassBy’s hourly data reveals this precisely.
Office and workplace proximity. The density of office workers within a 5-minute drive or walk directly predicts weekday lunch traffic. The hybrid work effect matters here: a location near offices that are busy Monday through Thursday but empty on Friday has a different weekly pattern than one near offices that operate five full days.
Income and education alignment. Fast casual customers typically skew higher income and higher education than QSR. The trade area’s demographic profile should reflect this. A fast casual concept in a trade area where the median household income is significantly below the brand’s average customer income will underperform.
Evening and weekend potential. While lunch drives the model, fast casual concepts that also capture dinner and weekend traffic have a higher revenue ceiling. Trade area data that shows strong evening foot traffic from residential neighborhoods, entertainment venues, or family-oriented activity centers suggests broader-daypart potential.
Casual dining
Evening traffic patterns. Casual dining depends on dinner. The critical traffic window is 5:30-9pm, particularly Thursday through Sunday. A location where evening traffic is strong on weekends but weak on weeknights may not support a casual dining restaurant’s fixed costs.
Family and group accessibility. Casual dining serves groups more often than QSR or fast casual. Parking capacity, easy ingress/egress, and proximity to family-oriented anchors (movie theaters, retail centers, entertainment venues) matter more for this format.
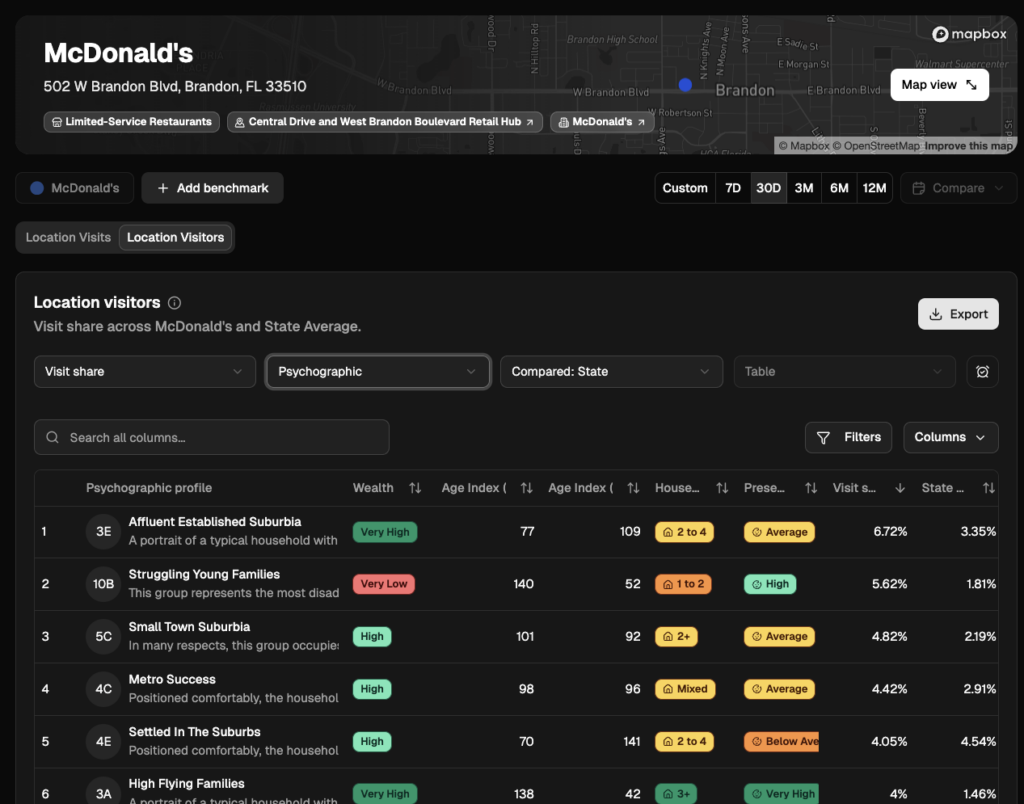
Occasion-driven anchors. Casual dining benefits from proximity to activities that create a dining occasion: movies, shopping, sporting events, concerts. The restaurant is often part of a larger outing rather than a standalone destination. Cross-visitation data shows which nearby activities drive the most overlap with dining traffic.
Alcohol licensing. For casual dining concepts where bar revenue is significant, confirming that the site allows alcohol service and that the licensing process is manageable is a practical requirement that can eliminate otherwise strong candidates.
How to use foot traffic data in restaurant site selection
Step 1: Define your daypart requirements
Before evaluating any sites, specify which hours and days drive your concept’s revenue. Map your existing top-performing stores’ hourly traffic patterns to establish what “good” looks like for your format.
Step 2: Screen markets for daypart traffic
Use PassBy’s data to identify markets and submarkets where daypart traffic aligns with your requirements. A lunch-focused fast casual brand screens for areas with high weekday midday traffic. A dinner-focused casual dining brand screens for areas with strong evening and weekend traffic.
Step 3: Evaluate candidate sites on restaurant-specific criteria
For each shortlisted site, assess: daypart traffic alignment, trade area demographics, competitive cluster dynamics, drive-thru or access feasibility, co-tenancy effects, and cannibalization risk against existing locations.
Step 4: Model revenue by daypart
Use hourly traffic data, your historical conversion rate by daypart, and average check size to model revenue for each candidate site. A site where 70% of projected revenue comes from the lunch daypart and lunch traffic is strong is a lower-risk bet than one where the model depends on building dinner traffic that does not yet exist.
Step 5: Validate with a site visit
Visit the top candidates during your target dayparts specifically. A lunch-focused concept should visit at 11:30am on a Tuesday, not 2pm on a Saturday. Observe the traffic flow, parking behavior, competitive activity, and overall energy of the area during the hours that matter.
For the full general site selection process, see our retail site selection guide. For the criteria framework, see site selection criteria.
Ready to evaluate restaurant sites with daypart foot traffic data? Book a 15-minute walkthrough of Almanac →
FAQ
How do restaurants choose locations? Successful restaurant brands evaluate locations based on daypart-specific foot traffic (not just total traffic), trade area demographics, competitive cluster dynamics, drive-thru or access feasibility, and co-tenancy effects. The emphasis on each factor varies by format: QSR prioritizes speed of access and commuter patterns, fast casual prioritizes weekday lunch density, and casual dining prioritizes evening and weekend traffic.
What is the most important factor in QSR site selection? Traffic during the target daypart. A location’s total daily foot traffic is less relevant than its traffic during the specific hours the QSR concept serves. A site with moderate total traffic but strong lunch-hour concentration will outperform a site with higher total traffic but weak midday numbers. Drive-thru accessibility is the second most important factor for concepts where drive-thru revenue is significant.
How far do restaurant customers travel? QSR customers typically travel 5-7 minutes. Fast casual customers travel 7-10 minutes. Casual dining customers travel 10-15 minutes. These distances are shorter than most retail categories, which makes the trade area analysis more sensitive to barriers (highways, intersections) and directional effects (commuter flow).
Should a QSR open near competitors? Often, yes. QSR benefits from cluster effects: a concentration of fast food options creates a dining destination that draws more total traffic than any single restaurant would attract alone. The key is whether the cluster has sufficient total traffic to support an additional concept. Trade area foot traffic data quantifies this by showing the combined visitor volume across the cluster and whether it is growing or declining.
How does hybrid work affect restaurant site selection? Hybrid work has changed weekday traffic patterns near office buildings. Locations that depended on five-day-a-week office occupancy now see reduced Tuesday-to-Thursday traffic and minimal Monday/Friday traffic in some markets. Foot traffic data at the hourly and daily level reveals which specific office corridors still generate strong midday traffic and which have been permanently weakened.
How do franchise brands avoid cannibalization between locations? Trade area overlap analysis compares each proposed location’s catchment against all existing franchisee territories. Most franchise agreements set a maximum acceptable cannibalization threshold (typically 15-25%). PassBy’s data quantifies the projected overlap before a new franchise location is approved. See our cannibalization guide for the full framework.