

Americans spend billions of dollars on Halloween costumes, decorations, and candy each year, but Party City is going bankrupt. As 20% of Party City annual sales come from Halloween, are businesses still benefiting from Halloween?
See our analysis of foot traffic for the retail industry for October 2023, including predictions using our artificial intelligence (AI) in the full report below.
Key highlights from our data analysis
- Most retail stores are experiencing a decrease in visits compared to 2019 – only four major cities this October could see an increase in footfall
- Philedlphia will see the most foot traffic in October with over 26,000 visits
- Augusta in Maine has the best foot traffic year-on-year performance this October with an increase of 23%
- Anchorage retailers will struggle this October as foot traffic falls by 15.2% this October and 26.7% compared to 2019
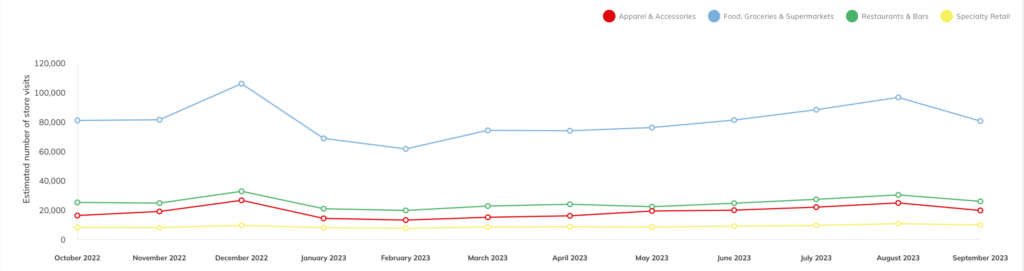
- Speciality retailers are seeing significant increases in traffic compared to 2019 and 2022 in some cities
Halloween shouldn’t spook businesses. Many areas can now expect to see an increase in footfall compared to last year according to our AI predictions. However, while some areas show signs of recovery after the pandemic, many are still struggling.
Sign up now to Almanac to see how your city, state, region and business type is performing.
Top five cities for Halloween foot traffic
The top five cities this October spooky season are:
- Augusta, Maine
- Oklahoma City
- Helena, Montana
- Dover, Delaware
- Concord, New Hampshire
Few cities across the US are seeing an increase in footfall across the board, particularly when we compare 2023 to 2019. However, some categories such as specialty retailers, restaurants, and supermarkets are beating the odds according to our data and predictions.
Data is changing the way retailers operate. AI can now accurately predict foot traffic for the next 90 days. For Halloween and other large seasonal events, retailers need to make a benchmark of what they can expect based on their industry. Expectations can then be set and an effective data-driven strategy to increase those numbers can be made.
1. Augusta, Maine
- Total foot traffic for October: 22,206
- October year-on-year: 23% increase
- 2019 benchmark: 4.4% increase
Few cities in our analysis achieved the numbers Augusta reached. But where is this increase coming from?
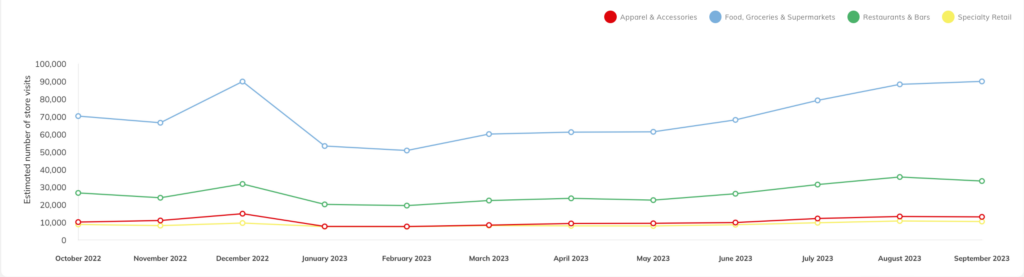
Out of all categories, supermarkets and food stores saw the sharpest increase in September. If retailers play their cards correctly, an increase in footfall for Halloween party shoppers is well within reach.
Specialty retailers, such as party stores and bookshops, have also seen an increase year-on-year.
2. Oklahoma City
- Total foot traffic for October: 18,573
- October year-on-year: 17.7% increase
- 2019 benchmark: 2.9% increase
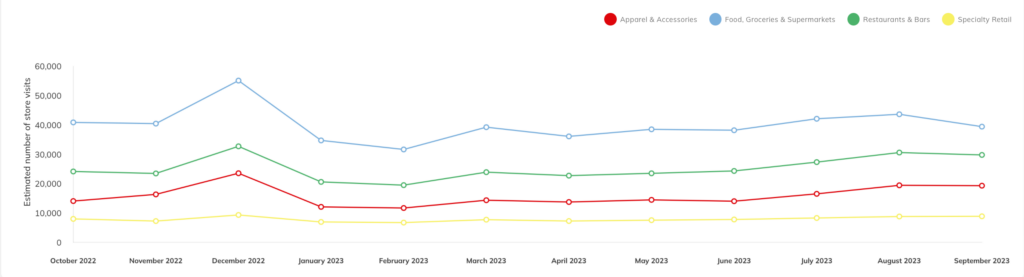
While food stores and supermarkets are bringing in the biggest footfall, apparel and accessory stores have seen the sharpest increase these past few months with September performing at over 50% year-on-year.
October and the Halloween season could be an opportunity for these stores, with the right marketing strategy, to benefit from seasonal shoppers.
3. Helena, Montana
- Total foot traffic for October: 15,292
- October year-on-year: 10.4% increase
- 2019 benchmark: 0.1% increase
While other cities have seen a rise in footfall for food stores and supermarkets, the category is faltering in Helena. Meanwhile, restaurants and bars have experienced an increase in footfall of over 16% in September compared to 2022 and this category shows no signs of decreasing.
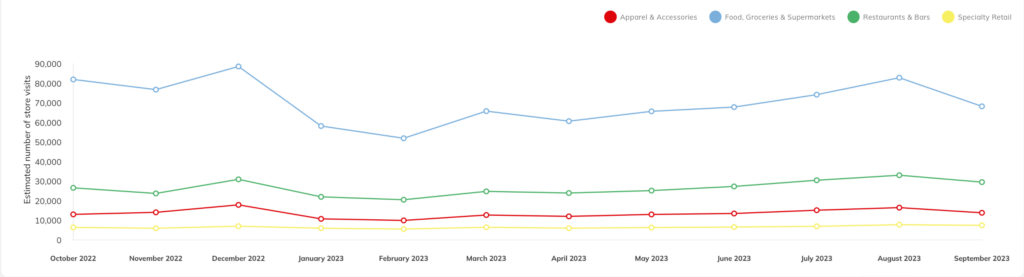
4. Dover, Delaware
- Total foot traffic for October: 21,249
- October year-on-year: 8.8% increase
- 2019 benchmark: 0.5% increase
Dover’s speciality stores saw a surprising increase during September with a year-on-year improvement of over 11%. These numbers have been shaky throughout 2023, but if retailers are able to capitalize on the Halloween season we could see another good month for specialty stores.
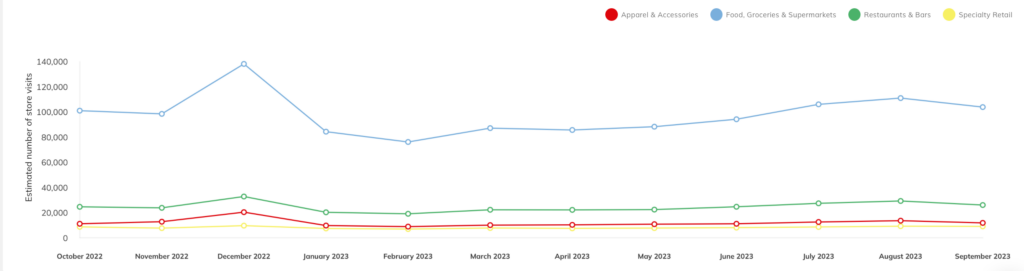
5. Concord, New Hampshire
- Total foot traffic for October: 18,698
- October year-on-year: 8% increase
- 2019 benchmark: 0.3% increase
While Concord has technically seen a slight decrease (0.3%) in overall foot traffic compared to 2019, it is still outperforming compared to 2022 with many categories seeing positive numbers.
Speciality retail stores here have seen a good rise in footfall, bringing in over 9,000 visits during September. That’s an increase of 24% compared to 2019. Concord has many locations that deliver a unique experience to consumers – from records to candy stores.
October foot traffic predictions by city
We’ve analyzed the capital cities of every state and some of the big cities to provide brick-and-mortar stores and businesses with in-depth information. Scroll down to see how your city is performing.
Quote from Sam, “Halloween will be a time to test brick-and-mortar retail as the industry cannot rely on foot traffic during this season as a given. Online shopping means brick-and-mortar retailers need to make adjustments.”
| City | Predicted October 2023 Visits | October Year-on-Year Foot Traffic | 2019 Benchmark |
| Albany, New York | 21,616 | 11.1% increase | 6.2% decrease |
| Anchorage, Alaska | 14,523 | 15.2% decrease | 26.7% decrease |
| Annapolis, Maryland | 16,006 | 3.4% decrease | 11.1% decrease |
| Atlanta, Georgia | 15,837 | 9.7% decrease | 22.8% decrease |
| Augusta, Maine | 22,206 | 23% increase | 4.4% increase |
| Austin, Texas | 15,476 | 8.2% decrease | 13% decrease |
| Baltimore | 19,909 | 0.3% decrease | 12.6% decrease |
| Baton Rouge | 16,328 | 10.2% decrease | 18.1% decrease |
| Bismarck, North Dakota | 15,437 | 1.5% increase | 8.4% decrease |
| Boise, Idaho | 17,660 | 0.5% decrease | 14.9% decrease |
| Boston, Massachusetts | 22,483 | 7.5% increase | 13.7% decrease |
| Bridgeport, Connecticut | 20,710 | 5.8% increase | 8% decrease |
| Carson City, Nevada | 17,325 | 0.3% increase | 17.5% decrease |
| Charleston, West Virginia | 17,373 | 4.1% decrease | 17.9% decrease |
| Charleston, South Carolina | 17,888 | 6.4% increase | 3.8% decrease |
| Charlotte, North Carolina | 17,855 | 7.3% decrease | 13.1% decrease |
| Cheyenne, Wyoming | 16,204 | 3.8% decrease | 14.5% decrease |
| Chicago | 22,787 | 5.3% increase | 12.4% decrease |
| Columbia, South Carolina | 20,010 | 1.7% increase | 11.1% decrease |
| Columbus, Ohio | 21,027 | 2.6% decrease | 14% decrease |
| Concord, New Hampshire | 18,698 | 8% increase | 0.3% decrease |
| Des Moines, Iowa | 17,379 | 2.2% decrease | 13% decrease |
| Detroit, Michigan | 18,597 | 1.8% increase | 17.2% decrease |
| Denver, Colorado | 15,685 | 5.2% decrease | 11.4% decrease |
| Dover, Delaware | 21,249 | 8.8% increase | 0.5% decrease |
| Fargo, North Dakota | 16,380 | 4.8% decrease | 14.7% decrease |
| Frankfort, Kentucky | 18,847 | 5.5% decrease | 15.3% decrease |
| Harrisburg, Pennsylvania | 16,819 | 7.3% decrease | 19.5% decrease |
| Hartford, Connecticut | 18,224 | 6.2% increase | 19.1% decrease |
| Helena, Montana | 15,292 | 10.4% increase | 0.1% increase |
| Honolulu, Hawaii | 17.604 | 1% decrease | 19.7% decrease |
| Houston, Texas | 16,250 | 7.5% decrease | 17.3% decrease |
| Indianapolis | 18,346 | 8.1% decrease | 19.9% decrease |
| Jackson, Mississippi | 15,008 | 3.8% decrease | 17.4% decrease |
| Jacksonville, Florida | 18,419 | 13% decrease | 16,9% decrease |
| Jefferson City, Missouri | 16,156 | 5.8% decrease | 18.6% decrease |
| Juneau, Alaska | 12,011 | 11.5% decrease | 19.8% decrease |
| Lansing, Michigan | 18,587 | 2.2% increase | 14.2% decrease |
| Las Vegas, Nevada | 19,498 | 8.8% decrease | 23.5% decrease |
| Lincoln, Nebraska | 15,954 | 7.5% decrease | 18.8% decrease |
| Little Rock, Arkansas | 17,712 | 11.7% increase | 4.8% decrease |
| Los Angeles, California | 20,356 | 1.4% decrease | 16% decrease |
| Madison, Wisconsin | 16,596 | 8.1% increase | 6.9% decrease |
| Manchester, New Hampshire | 18, 246 | 9.1% increase | 6.7% decrease |
| Milwaukee, Wisconsin | 20,340 | 6.1% increase | 8.5% decrease |
| Minneapolis, Minnesota | 20,288 | 7.9% increase | 10.5% decrease |
| Montgomery, Alabama | 15,641 | 8.8% decrease | 16.4% decrease |
| Montpelier, Vermont | 13,254 | 4.3% increase | 18.1% decrease |
| Nashville, Tennessee | 18,551 | 5% decrease | 13.9% decrease |
| New York City | 25,835 | 14.8% increase | 5.5% decrease |
| New Orleans | 16,075 | 11.7% decrease | 26.1% decrease |
| Oklahoma City | 18,573 | 17.7% increase | 2.9% increase |
| Olympia, Washington | 20,282 | 11.4% increase | 2.2% decrease |
| Omaha, Nebraska | 16,972 | 6.2% decrease | 17.1% decrease |
| Philadelphia, Pennsylvania | 26,557 | 18.4% increase | 0.2% decrease |
| Phoenix, Arizona | 17,008 | 12.2% decrease | 21% decrease |
| Pierre, South Dakota | 13,987 | 7.8% decrease | 8.4% decrease |
| Portland, Oregon | 17,197 | 5.5% increase | 17% decrease |
| Portland, Maine | 16,026 | 20.1% increase | 3.7% increase |
| Providence, Rhode Island | 21,178 | 14,1% increase | 10.8% decrease |
| Raleigh, North Carolina | 18,797 | 6.8% decrease | 15.9% decrease |
| Richmond, Virginia | 18,325 | 3.8% decrease | 12.5% decrease |
| Sacramento, California | 17,489 | 4.5% decrease | 15.1% decrease |
| Saint Paul, Minnesota | 19,446 | 3% increase | 11% decrease |
| Salem, Oregon | 19,445 | 6.4% increase | 9.1% decrease |
| Salt Lake City, Utah | 17,524 | 3.3% decrease | 23.5% decrease |
| Santa Fe, New Mexico | 15,208 | 7.1% decrease | 13.5% decrease |
| Seattle, Washington | 18,156 | 12.4% increase | 4.9% decrease |
| Springfield, Illinois | 19,166 | 1.4% decrease | 10.9% decrease |
| Tallahassee, Florida | 19,064 | 4.2% decrease | 13.4% decrease |
| Topeka, Kansas | 16,870 | 3.4% decrease | 15.8% decrease |
| Trenton, New Jersey | 22,099 | 14.3% increase | 5.8% decrease |
Sign up now for our data platform Almanac to see how your city, state, region and business type is performing.
How our data is collected
At pass_by we value quality over quantity. Our results are consistently validated with ground-verification. Our data comes from more than 15 sources to provide the best possible quality for our clients.
Read more about our data methodology.
About pass_by
pass_by isn’t just a new company; it’s the culmination of a vision. A vision to bridge the gap between data-driven insights and real-world behavior. In a world inundated with data, pass_by has emerged with a singular focus: to harness this data in ways previously unimagined, ensuring accurate, relevant, and actionable intelligence.
Read more about our mission to revolutionize data intelligence for businesses.