Consumer Packaged Goods (CPG) retailers use analytics to get ahead of competitors and optimize operations. Using data analytics is key. But using it isn’t always straightforward. Keep reading to discover more about CPG analytics and how to use it.
At pass_by, we offer the highest in market accuracy with 94% correlation to ground truth, over 15 data inputs, and a full 90 days of predictive feeds. Book a call now.
What is CPG?
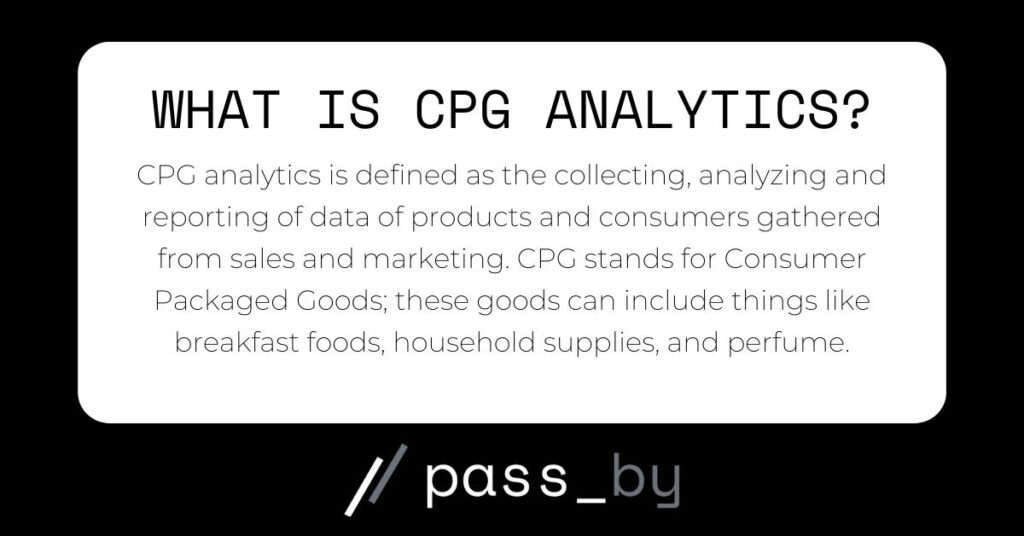
CPG stands for Consumer Packaged Goods; these goods can include things like breakfast foods, household supplies, and perfume.
CPGs can be sold by third parties, in a brand’s brick-mortar store, or in a pop-up shop. For example. Kellogg’s cereal being sold in Walmart instead of the cereal brand having its own store.
What is CPG data analytics?
CPG data analytics is defined as the collecting, analyzing and reporting of data of products and consumers gathered from sales and marketing.
CPG data analytics aims to support businesses in spotting opportunities, optimizing processes, and analyzing the competition to spot trends.
What are CPG data sources?
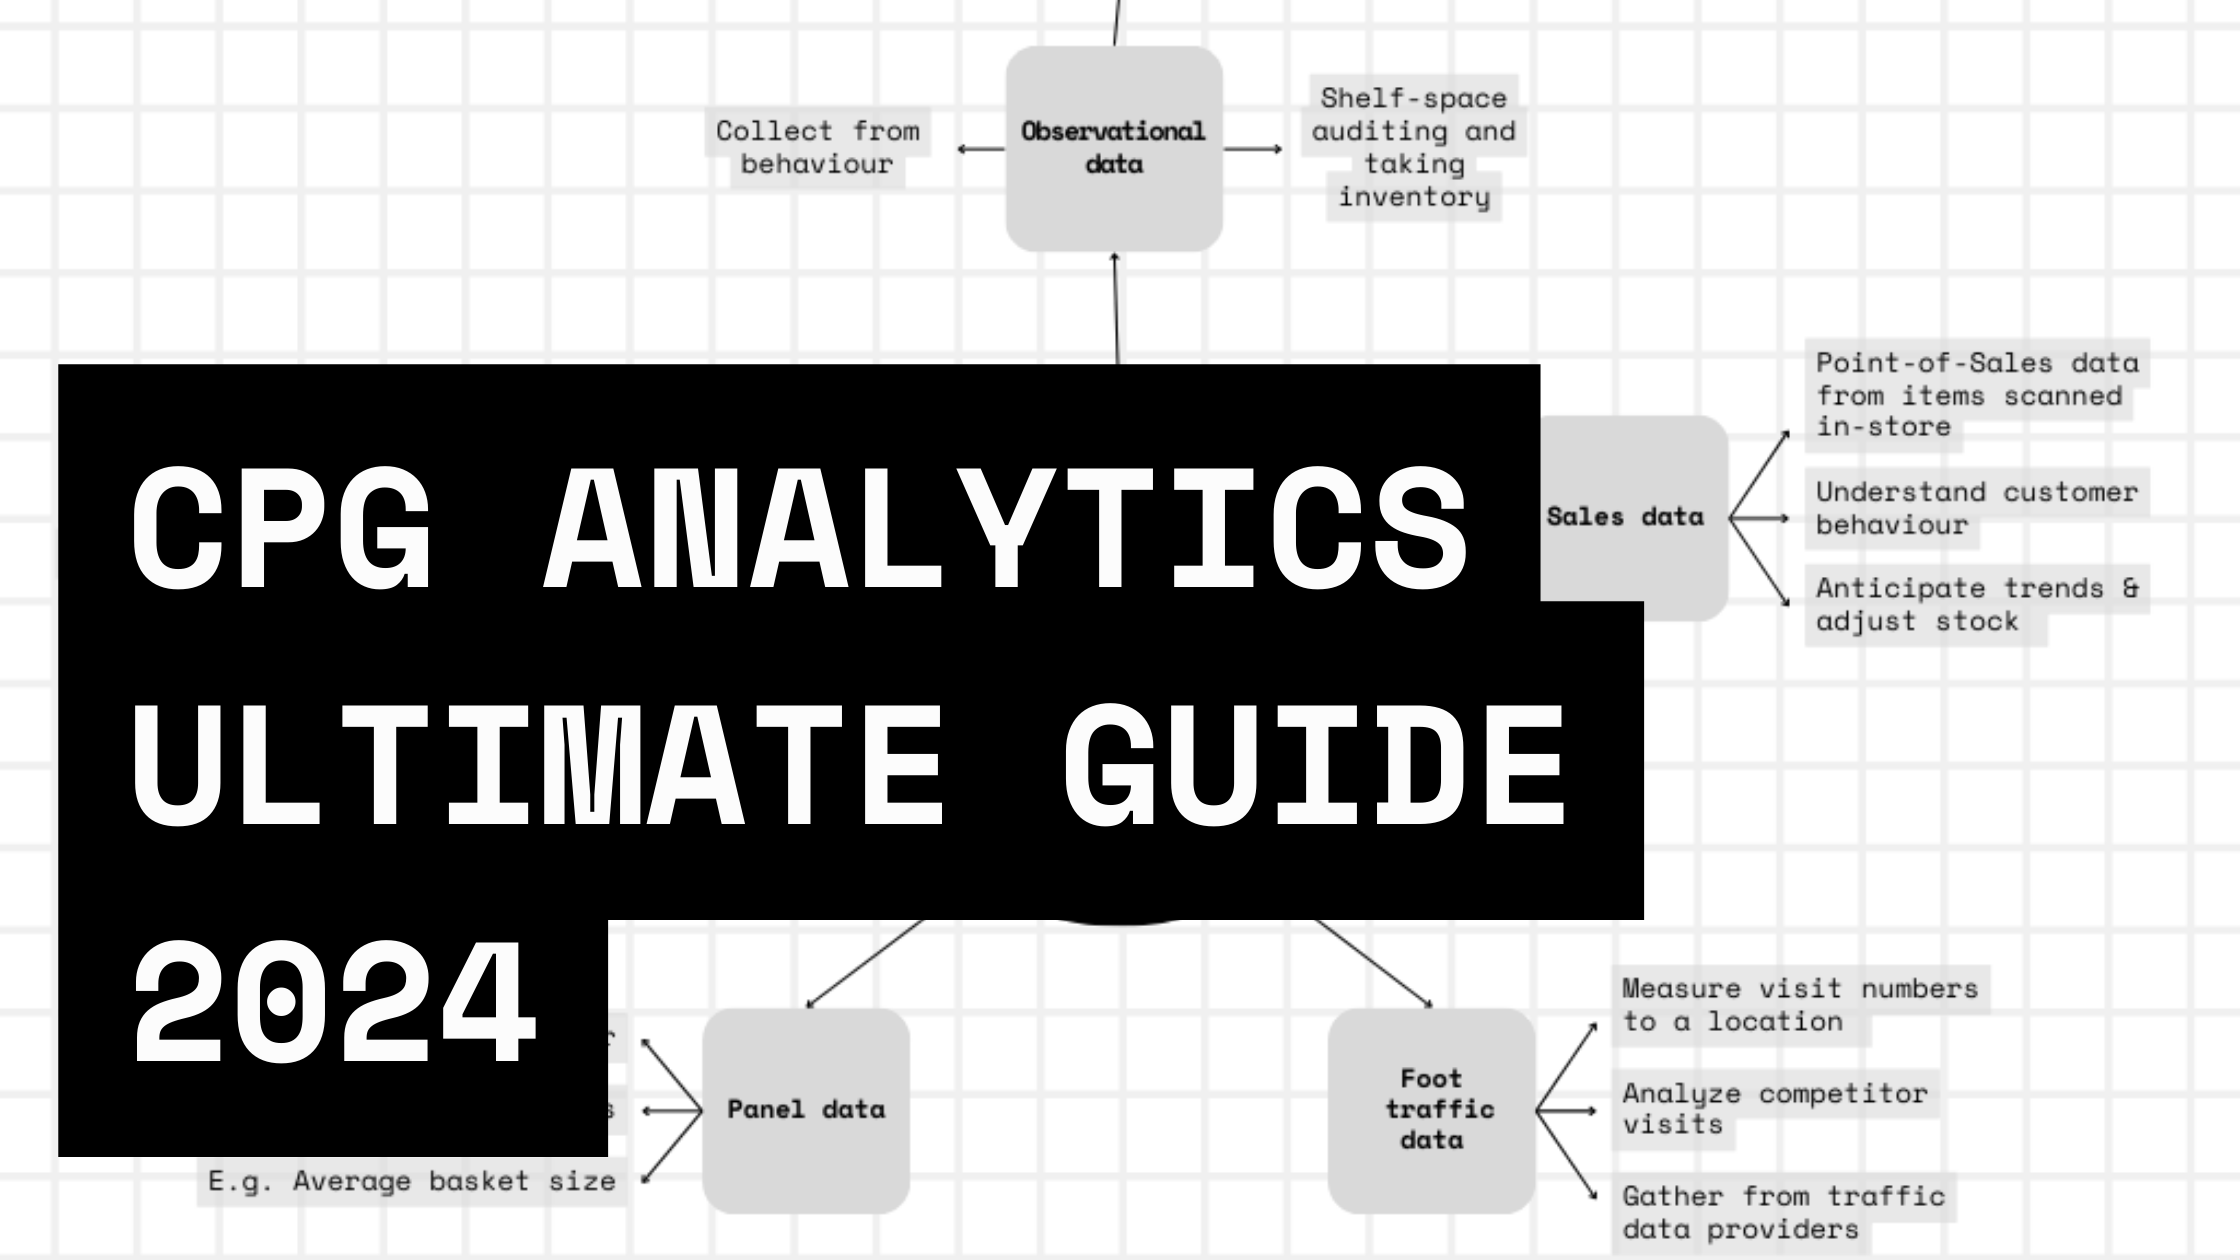
In CPG data analytics, there are five main sources of data brands should pay attention to observational data, activity data, sales data, panel data, and foot traffic data.
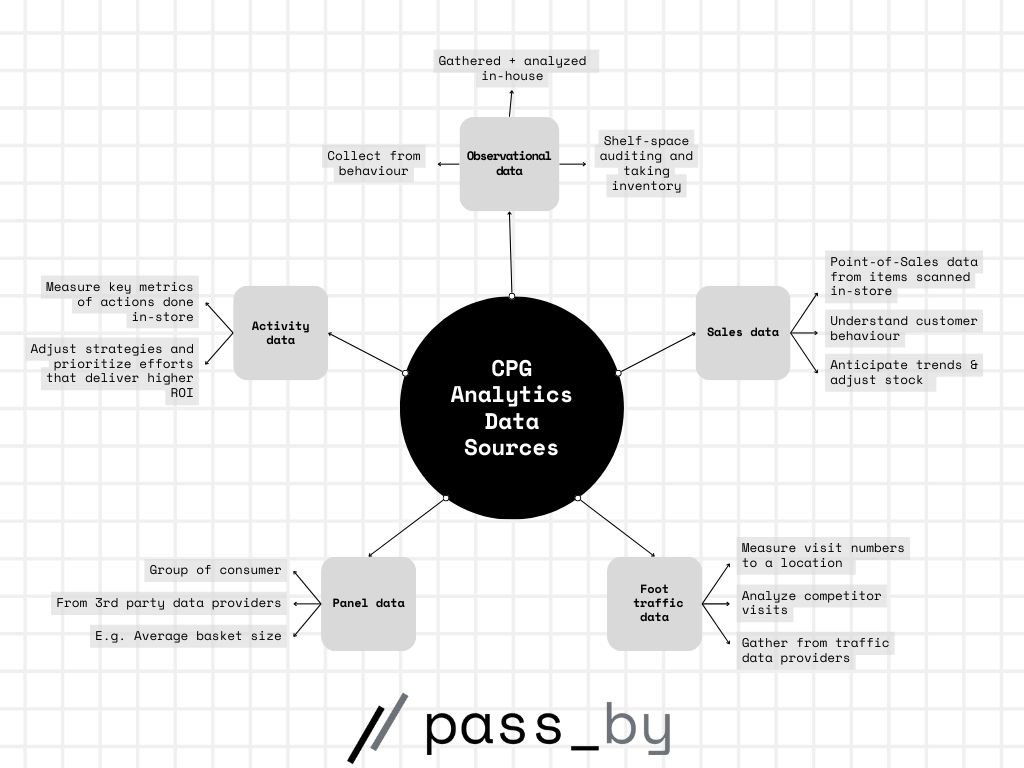
Observational data
Observational data is the in-field monitoring and collection of data from your representatives or employees. This type of data is gathered and analyzed fully in-house.
Employees can record foot traffic visits, behavior, and interactions from strategic places such as the entrance of a store or a product display.
Observational data can also be gathered from routine checks, such as shelf-space auditing and taking inventory.
Activity data
What are you doing to improve your performance in-store? Activity data measures these key metrics, such as actions they do the most or least in-store.
This data can provide a deep understanding of which activities have had the most remarkable impact on your sales figures, allowing you to adjust strategies and prioritize efforts that deliver higher ROI.
Panel data
A panel is a group of consumers across all demographics and household types created and tracked to gather data on retail visits, purchases, behavior, and attitudes.
Panel data is self-reported and collected from third-party data providers. Using a panel, retailers, and vendors can paint a clearer picture of consumer trends and shifting purchase habits.
Examples of panel data include:
- Average basket size: How much customers spend on average in your store.
- Frequency: How often customers are spending in your store.
Foot traffic data
Foot traffic data measures the number of visits to a geographic location, such as visits to a greengrocers. CPG businesses use foot traffic data to optimize inventory, adjust product placements, find suitable partners and new locations for expansion.
Stores can use hardware devices like sensors and footfall counters to count traffic in-store. To see competitor and partner foot traffic at high rates of accuracy for CPG analysis, you will need a foot traffic data provider.
Examples of foot traffic data used in CPG analytics include:
- Visit volume: How often consumers are visiting your store.
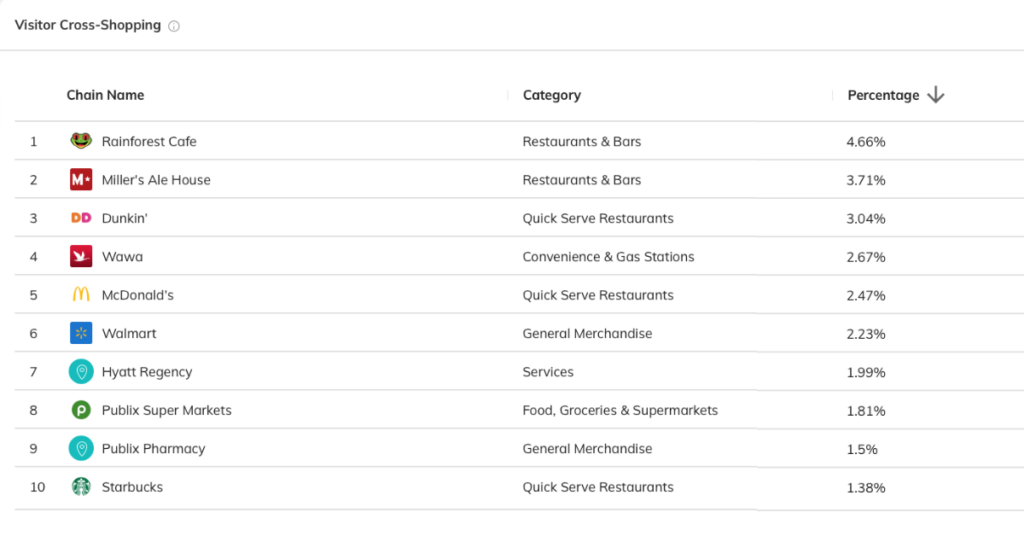
- Cross-shopping data: The percentage of visitors who are also going to other locations, such as your competitors.
- Predictive data: Consumer insights using AI-powered technology can forecast foot traffic for the next 90 days.
Sales data
Sales data is our final primary source of CPG analytics and one of the most well-known.
Point-of-Sales data tells you more about customer transactions; the volume, time, items scanned, etc. Each item scanned through the store’s system is logged and can then be analyzed.
Sales data can be sourced from your own POS system or your partner retailers.
Point-of-sale data is one key metric everyone has their eyes on – and for good reason. When analyzed alongside observational, activity, panel, and foot traffic data you get a clear picture of your overall performance.
Benefits of using CPG analytics to improve efficiency
The potential of CPG analytics goes far beyond a mere analysis of the cold hard figures. It can provide deep insights into the unique position of your brand that can help you capitalize on sales growth and overtake your competitors.
By leveraging CPG analytics, small brands can find a strong footing in a competitive market and plan for expansion and large retailers can discover new ways to boost effciency.
- Market share. This insight helps you comprehend your standing within market competition and assess potential opportunities for expansion.
- Understand your customers. CPG analytics looks at behavior and visits at a local and national level to pull out insights for better decision-making, communications, product placements, etc.
- Tailoring communications. Improved communications lead to better customer loyalty, making your business more sustainable over time.
CPG analytics also provides a window into customer loyalty and preferences, which are key to forging strong brand-customer relationships. Understanding customer behavior – breaking down loyalists, one-time shoppers, and switchers – is crucial to tailoring your communications and inspiring loyalty. This loyalty not only boosts business through repeat customers but often results in these customers becoming brand ambassadors.
Lastly, CPG analytics are not just beneficial in short-term gains or quick promotional wins. In fact, they are eligible for both short-term and long-term incentive programs, making your strategy sustainable in the long run. CPG analytics delivers insights and strategies that can propel your brand into a future of sustained growth and customer loyalty.
CPG analytics use cases
How do you use CPG analytics? Let’s explore a number of scenarios where using CPG data would transform the decision-making process and produce optimal results.
Our examples display the value CPG analytics can offer retailers including:
- Targetted marketing campaigns
- Cross-selling products
- Benchmarking reports
At pass_by, we offer the highest in market accuracy with 94% correlation to ground truth, over 15 data inputs, and a full 90 days of predictive feeds. Book a call now.
Use case 1: Targeted marketing campaigns
CPG brands include a wide range of consumers, each with distinct tastes, values, income, and needs. Targetted marketing sends the most relevant marketing materials to the customers most likely to convert.
Scenario: A CPG beauty company discovers a unique customer segment using in-depth data examination of foot traffic data, basket analysis, and market trends. Using these data sets, the company finds a subset of consumers with a particular interest in organic products.
When this new customer segment has been discovered, the company can then adjust existing marketing materials and campaigns to suit the segment; citing organic labeling, featuring organic products, and offering discounts on relevant products.
Targeted marketing using CPG analytics is essential to improving customer loyalty and improving the conversation rate of marketing campaigns.
Use case 2: Cross-selling products
Product recommendations are common in e-commerce to cross-sell products. For example, a customer may see an “Add to basket” pop-up while clicking on check-out.
In the brick-and-mortar world, cross-selling can be done by placing products in a strategic manner on the shelf or placing products in a display area.
Opportunities for cross-selling can be found through basket analysis and location data to see where else your customers are shopping.
Scenario: A home furnishing company discovers customers often visit the nearby coffee shop. With this insight, the company can consider opening an in-store cafe or installing a self-service coffee stand.
This methodology not only skyrockets sales volumes but also fosters a convenient and upgraded shopping experience for the customers.
To see where your customers shop, use Almanac’s reporting tool. Enter your shop location in the place report. From there, analyze the percentage of visitor cross-shopping to inform your decision-making.
Use case 3: Benchmarking reports
A benchmark is the standard or performance you can expect based on your industry, location, competitors, and customer base.
Create a benchmark report through Almanac following these steps:
- Login to your account.
- Click “benchmarking report” at the top of the page, beneath “create report”.
- Select a store chain or particular place.
- Select the date range of the data you’d like to include in the report.
- Load the report. From here, add up to four chains or locations to the report.
Scenario: A fashion retailer is deciding whether to open a new store after discovering an affordable location in a mall. The company creates a benchmarking report of stores within the mall to set performance expectations and evaluate the opportunity.
How to use CPG analytics
CPG analytics is essential in areas such as optimizing product assortments and store operations, gauging promotional activity effectiveness, and maximizing return on investment. Analytics can provide insights that lead to significant improvements in operational efficiency, cost reduction, and increased profitability.
For CPG retailers, this type of analytics is used to track current performance or predict future needs.
Track current performance using CPG data
While predictive insights are key to optimizing your business over time and overtaking competitors, tracking current performance is just as essential. Without this foundation, predicting future performance will be impossible.
Optimizing your current actions, stores, and stock all results in better performance. Data sets used in analyzing and tracking current performance are:
- Foot traffic data: This data can tell you when your customers are currently visiting, letting you adjust your store hours to suit your customer’s needs.
- Conversion rate: How well are your marketing campaigns performing? CPG data can provide insights on improving conversation rates using targeted campaigns.
- Shrinkage: Is your store inventory less than what is reported? If analysis reveals a large difference, you will take steps to reduce retail shrinkage.
Predicting future needs using CPG data
CPG analytics is an important tool when planning for the future of your business. Data used during this process includes:
- Foot traffic predictive insights: Predict the next 90 days of visits in-store using AI-powered insights.
- Competitor analysis: Compare competitor performance, including flagship stores of large brands and local competitors.
- Customer psychographics: Discover the age range, income and education level of your customers using aggregated data. This data not only helps you understand the present of your business, but helps you plan for future campaigns and branding.
- Partnerships: Using cross-sell data, discover potential partnership opportunities of businesses that complement your own.
How to access CPG analytics
To use CPG analytics, you will need to access a data platform. The first step is finding a provider that offers aggregated, accurate and precise data from a variety of trusted sources.
At pass_by, our reporting tool Almanac automatically generates reports for you, offers 90-day foot traffic predictions using AI-powered insights, and has a strong validation process.
At pass_by, we offer the highest in market accuracy with 94% correlation to ground truth, over 15 data inputs, and a full 90 days of predictive feeds. Book a call now.
CPG analytics FAQs
What is CPG experience?
CPG experience refers to the knowledge and skills acquired through direct involvement in the consumer packaged goods industry. It encompasses understanding customers’ buying habits, the competitive landscape, market trends, and how to leverage data analytics to drive business decisions. A solid CPG experience is a valuable attribute for those keen on working or thriving in this industry.
What is commercial analytics in CPG?
Commercial analytics refers to the process of gathering, analyzing, reporting, and acting on data in a commercial background. Commercial analytics in CPG is done by Consumer Packed Goods companies to optimize operations, improve performance, and make data-driven decisions.
What is the difference between CPG and retail?
Retail is the sale of various products across the industry while CPG is the specific creation, sale, marketing, and processing of consumer packaged physical goods sold to consumers. Retail is an umbrella term that encompasses an entire industry, while CPG is more specific.
What is an example of a CPG?
Consumer Packed Goods (CPG) are products sold to consumers through a retailer. Examples of CPGs include frozen fruit, sun protection, multivitamins, all-purpose cleaning spray, and perfume gift sets.
What are the largest CPG categories?
The largest categories in CPG include food and drink, toiletries and beauty products, domestic care and cleaning, pet care essentials, and over-the-counter medical and healthcare products.