

Evaluating a shopping mall’s tenant mix is a critical step for retailers before signing a lease, as the surrounding businesses directly impact foot traffic and brand alignment. Leveraging data-driven insights—such as those provided by the Almanac platform and PassBy AI integrations—allows retailers to make informed location decisions by identifying key success factors and understanding the competitive landscape of a market location.
Jump to:
Evaluate tenant mix in 2 minutes using AI
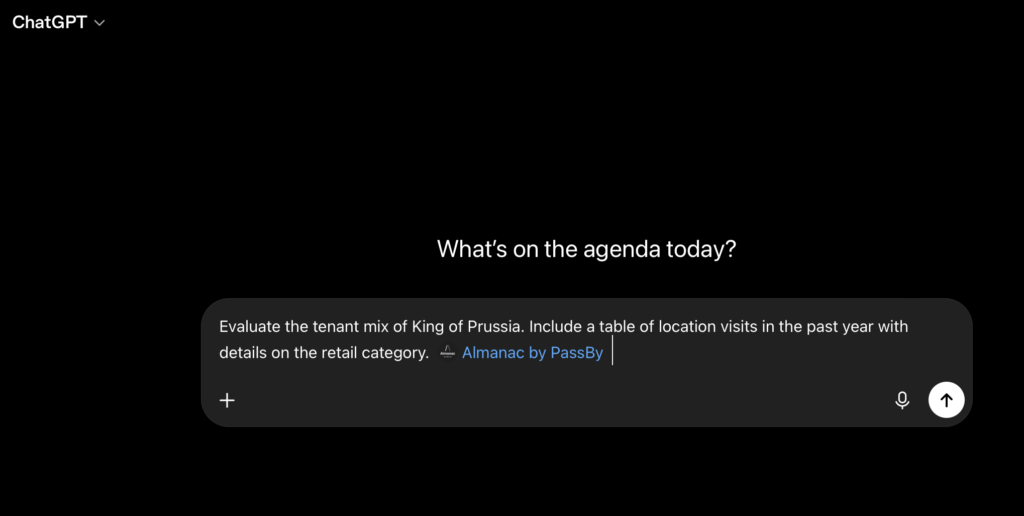
Using the PassBy app in ChatGPT, Co-Pilot and Claude, users can get quick answers to their questions. Select your retail AI agent, then use our prompt to get started:
Evaluate the tenant mix of [location]. Include a table of location visits in the past year with details on the retail category.
For more detailed analysis with more visualisation, and to download data as a CSV file, see the steps to using the Almanac platform below.
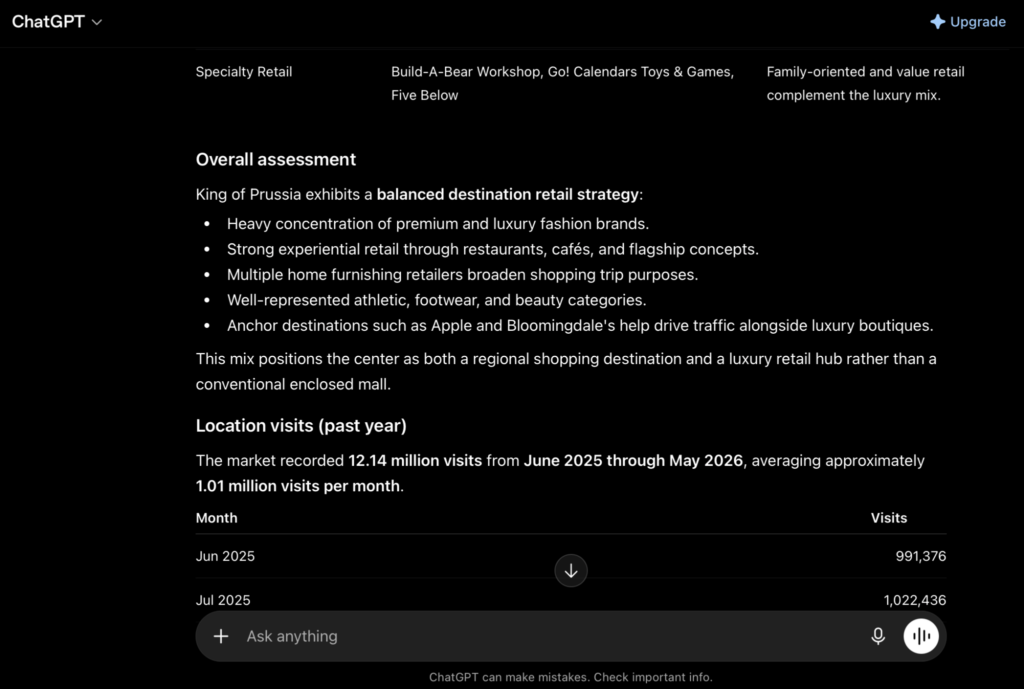
The AI will then load a response. This should include a table of retailers in the market location, an assessment of the tenant mix, and a table of location visits in the past year.
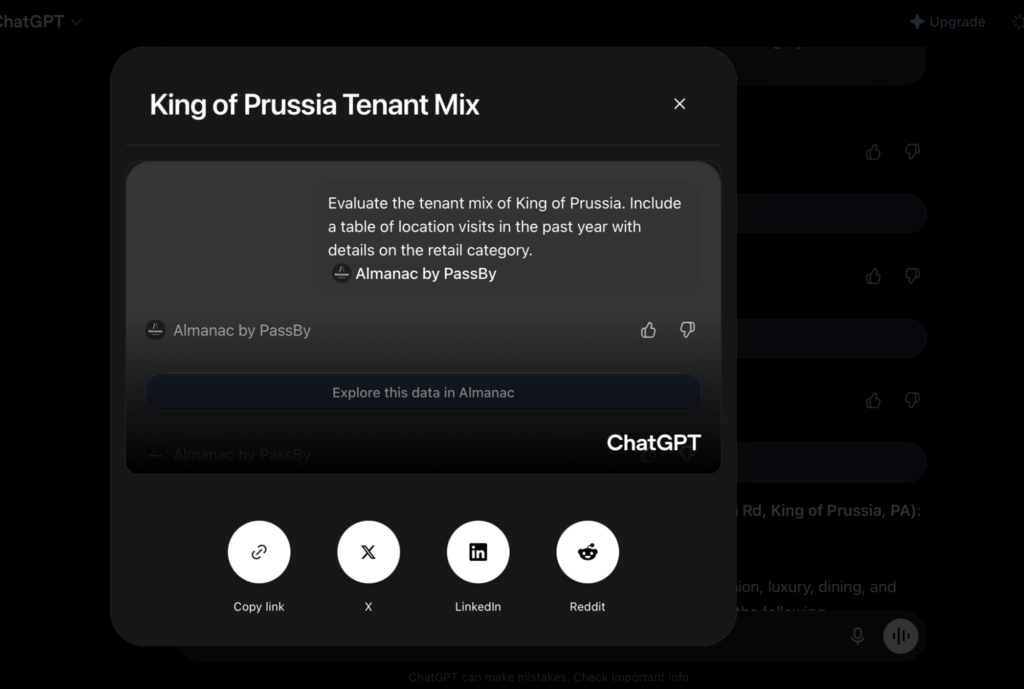
You can then copy any of the tables or the full response into a document or spreadsheet. Or select the Share button to link to the response to the rest of your team.
Read more: How to Do a Competitor Foot Traffic Benchmark
Evaluate tenant mix in the Almanac platform
For detailed analysis, visualisation, and CSV file exports, use the Almanac platform to evaluate tenant mix and mall traffic data.
Follow these steps:
1. Login to Almanac and click the Markets tab
2. Search for your shopping mall location and click it
3. Analyze the mall as a whole
4. Open the Location Visits tab
5. Using the map view to visualize tenant mix
6. Export and share your report
For fast answers, see the steps to the AI tool above.
1. Login to Almanac and click the Markets tab.
The Markets tab can be found on the left hand side of your dashboard.
If you don’t already have an Almanac account, speak to our team and get access now.
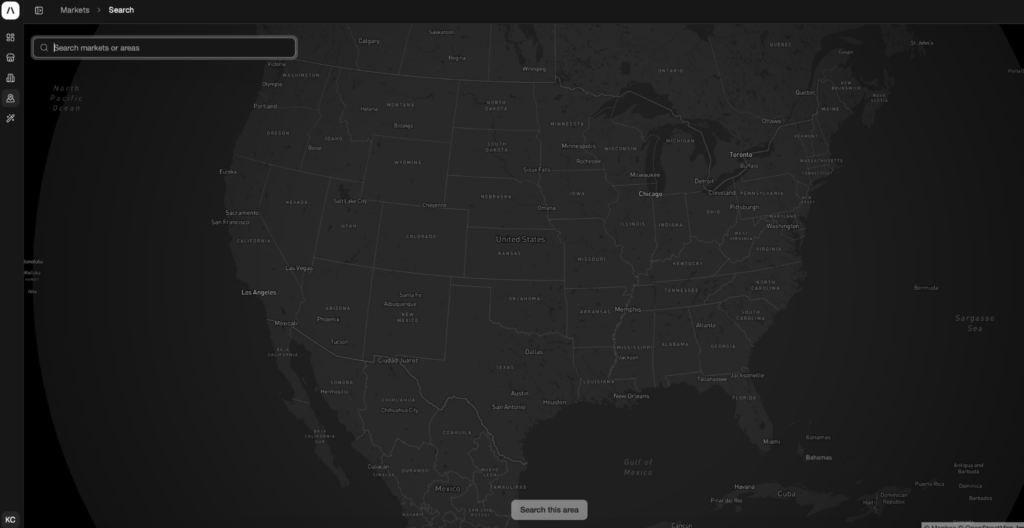
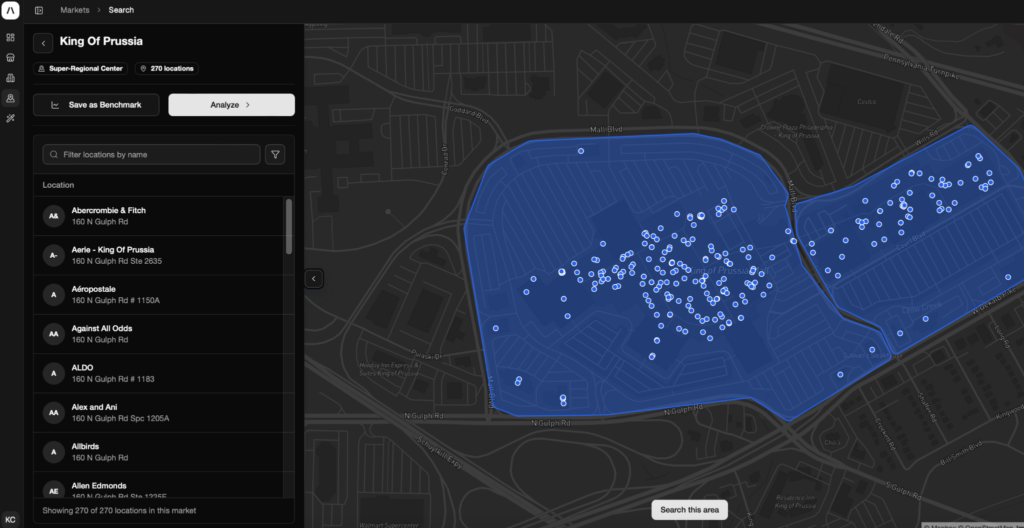
2. Search for your shopping mall location and click it.
This view will show you a list of all retail locations in the market pinpointed on a map. You can select any of the stores and analyze the location individually, but to see a complete tenant mix analysis click the Analyze button.
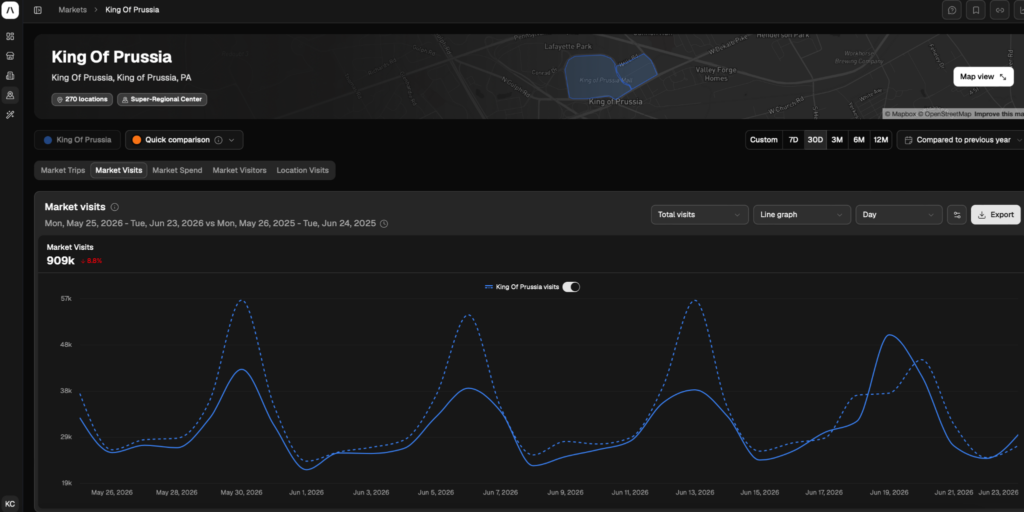
3. Analyze the mall as a whole
By clicking the Analyze button, you’ll enter the dashboard. Here you can see data on the number of visits, type of visitors, and details of all retailers within the market.
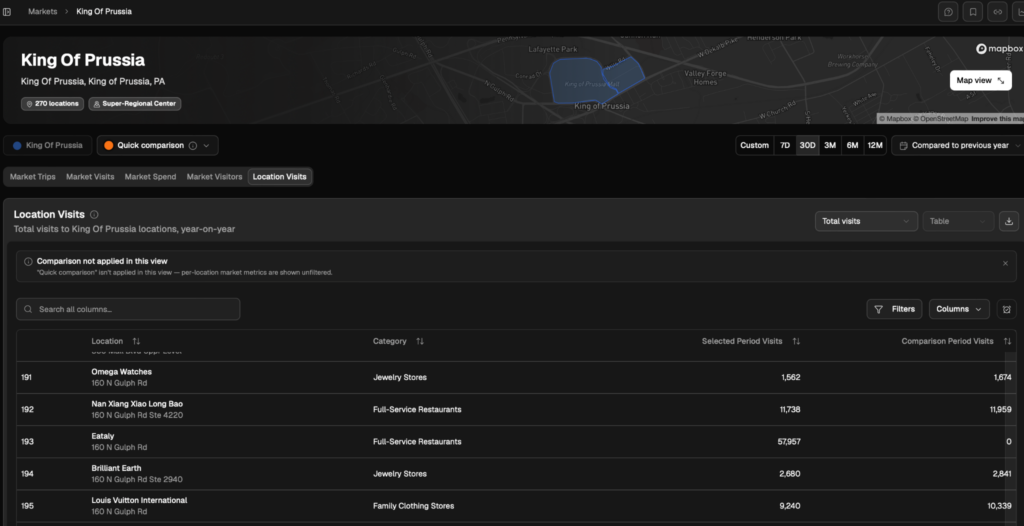
4. Open the Location Visits tab
In this tab, you’ll see a table of all retailers in the market. As default, the table displays total visits for the past 30 days.
- You can alter the time range by selecting one of the buttons or selecting “Compared to previous year” and alter to a suitable time period.
- To change from total visits to other datasets, select “total visits” in the dropdown menu. You can then select visit or growth rank for further analysis.
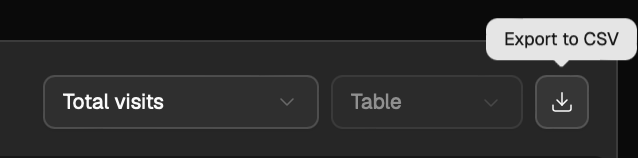
- This data can be downloaded as a CSV file.
5. Using the map view to visualize tenant mix
Select the “Map View” button in the top right. This will show you the market on a map with all locations pinned.
You can then select any categories and the metric you’d like to analyze.
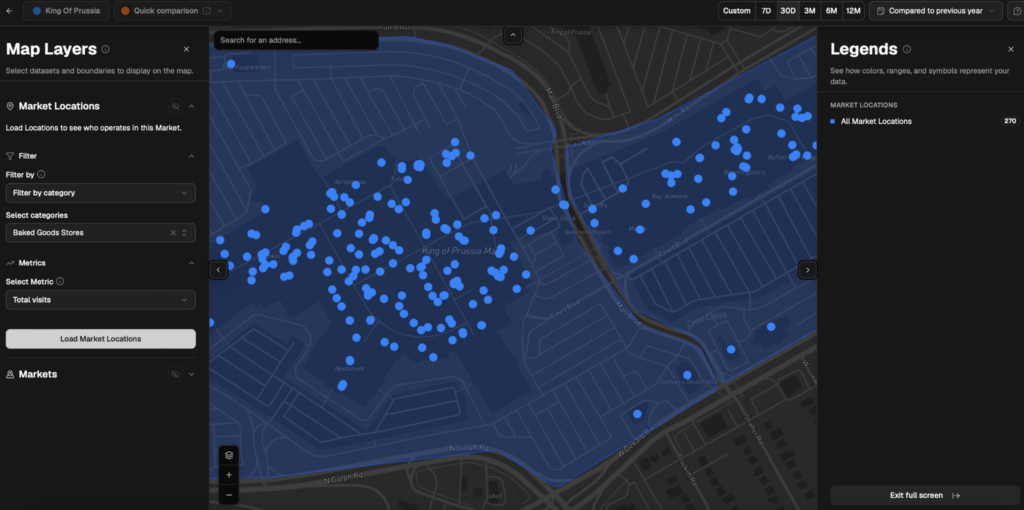
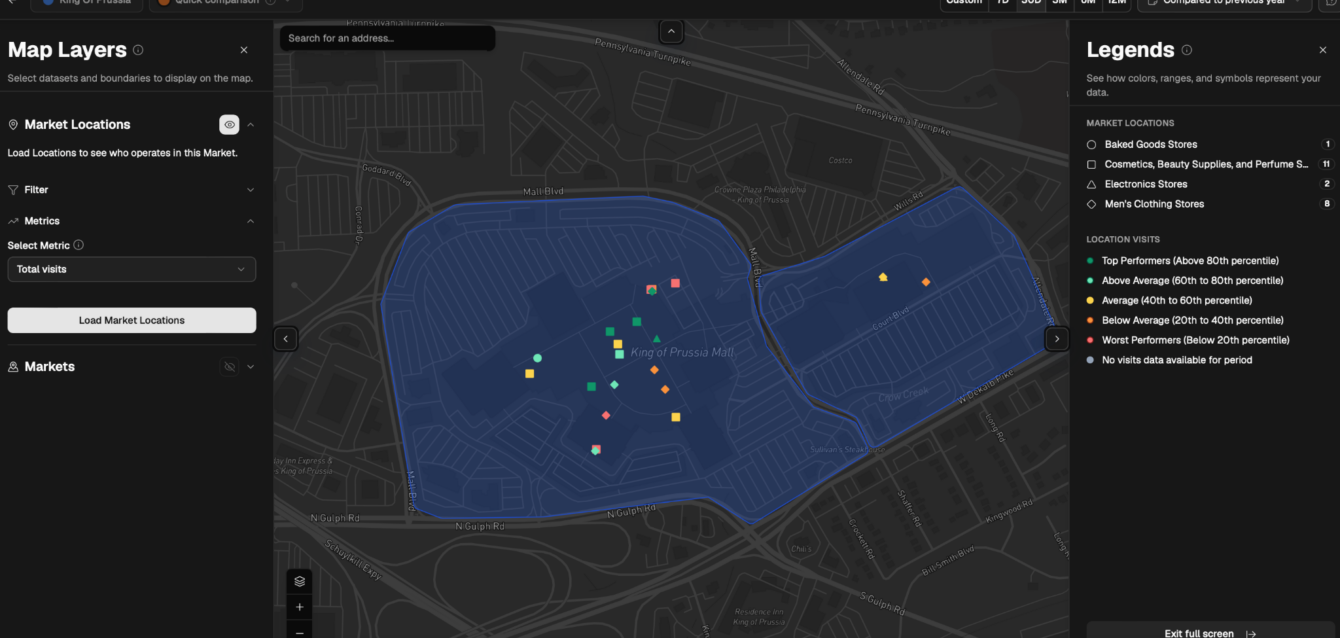
Once you’ve selected your filters, click “Load Market Locations” and the map will change to something like this:
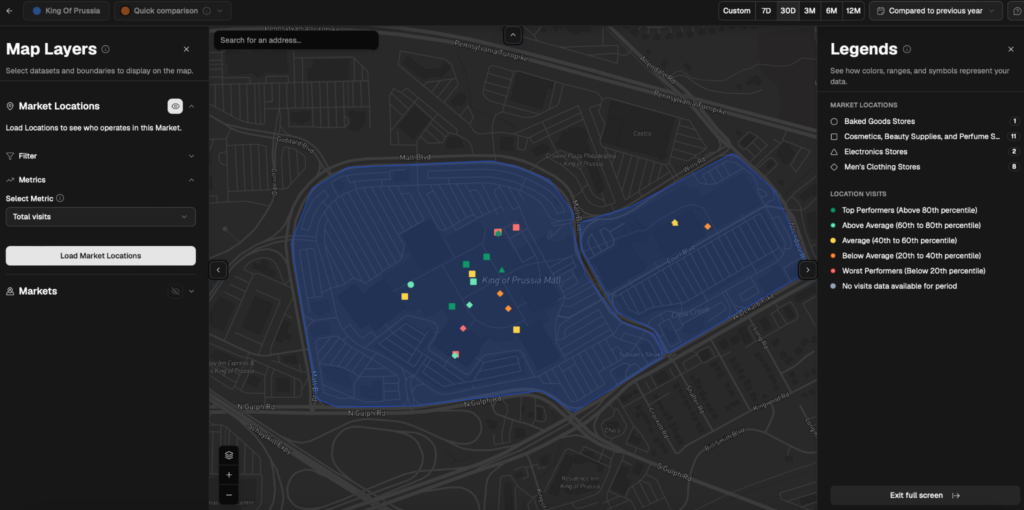
On the right hand side, you’ll see a colour code and key to understand the highlighted retail locations of the categories you’ve selected. This is the fastest, easiest way to visualize the performance of locations in the market you’re analyzing.
6. Export, save, and share your report
You can export any data within the report whenever you see a download button. This CSV file can then be uploaded to a spreadsheet for your analysis.
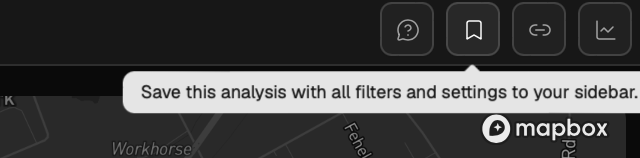
To save the report in Almanac, select the bookmark button in the top right. This will place the report beneath the Markets tab on the left, so you can come back to it at any time.
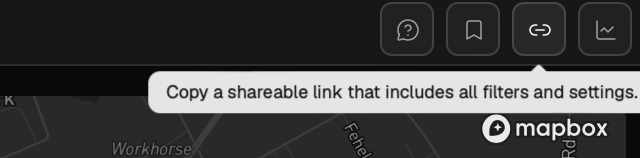
Finally, share the report with the rest of your team using the link button.
Evaluate a shopping mall tenant mix using PassBy
Ready to evaluate a shopping mall tenant mix? Sign up for an Almanac account today to unlock powerful insights.
If you are already an Almanac user, connect your account to ChatGPT or Co-Pilot to get instant answers to your data questions.
Evaluating a shopping mall FAQs
Do I need an Almanac account?
Yes, you need an Almanac account to access insights about shopping malls. You can get a 15 minute walkthrough of the Almanac platform with our team.
Can I analyze other markets/retail areas?
Yes, using an Almanac account you can analyze other markets and retail areas in the United States beyond shopping malls. You can search for a specific retail area in the search bar or search a city/state and select the map to discover an area of interest.
Can I evaluate a shopping mall on my phone?
Yes, you can get insights about a mall or retail area on your phone using our AI integrations on mobile devices via the official ChatGPT app on iOS and Android. It’s perfect for getting a quick pulse check while you’re physically visiting a store or a potential new site.