

When foot traffic or same-store sales dip, internal point-of-sale (POS) data only tells half the story. You can see that fewer customers are walking through your doors, which often leads teams to blame seasonality, weather, or broader economic trends—while missing the real culprit down the street.
The fastest way to uncover whether rivals are actively pulling shoppers away from your locations is through cross-shopping intelligence. Market intelligence platforms like Almanac by PassBy analyze consumer foot traffic across US retailers, showing you exactly which competing brands your customers are visiting instead.
If you want to run this analysis on your own stores right away, you can test all of Almanac’s features with a free 24-hour trial (no sales call required).
1. Pull up your brand’s cross-shopping baseline
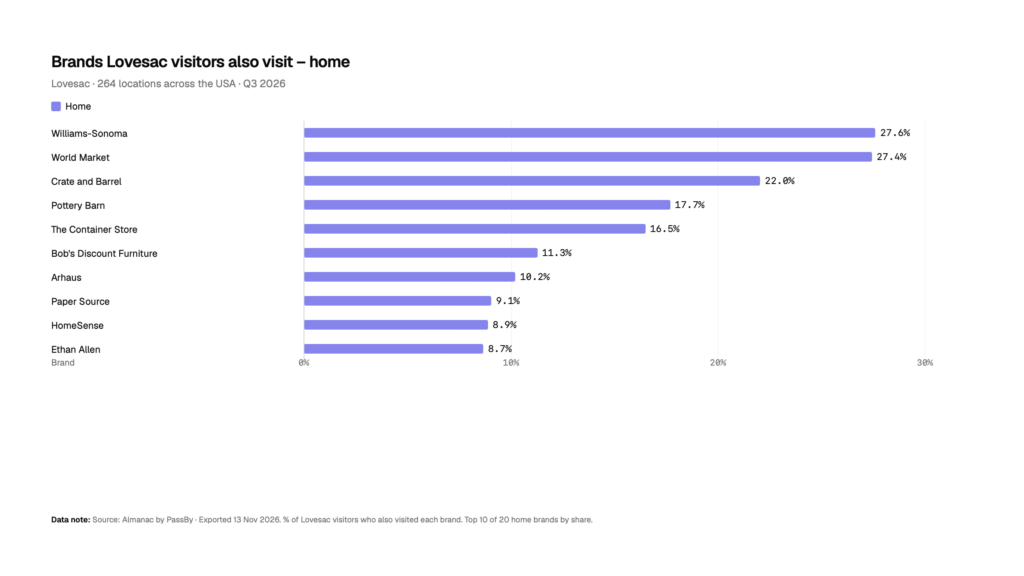
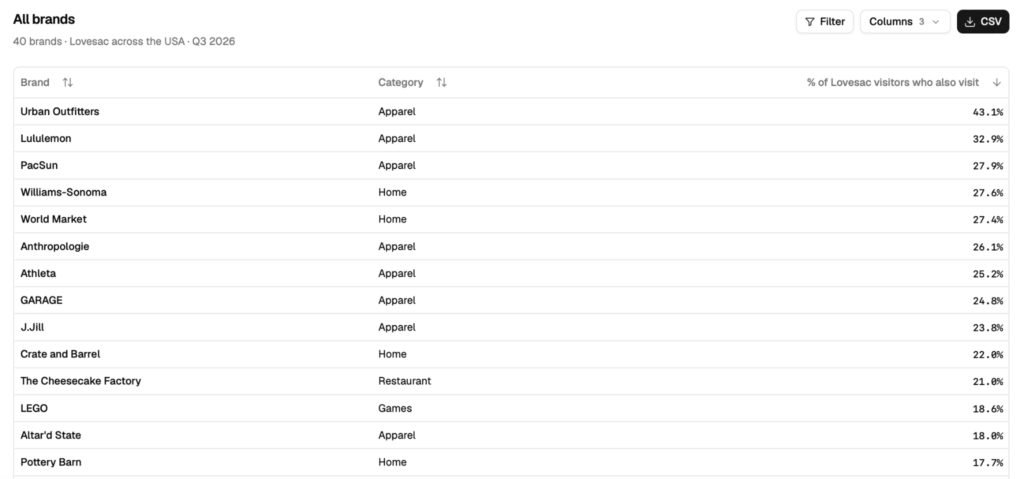
Log in to Almanac (new users will simply enter their brand name to start) and open the My Customers – Cross shopping tab in the left-hand sidebar. This immediately surfaces the top brands your visitors also frequent.
2. Segment by store type and location attributes
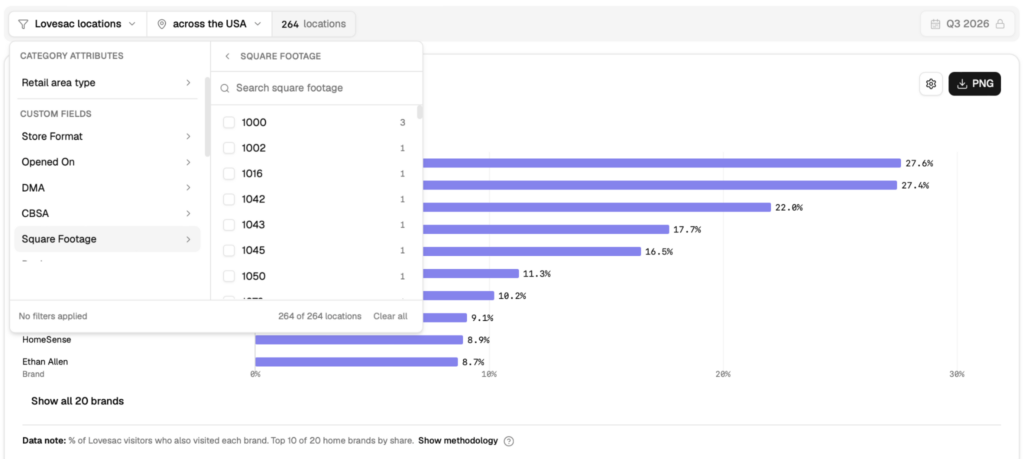
National averages can hide localized threats. Use the location selector in the top-left corner to filter by specific regions, area types (urban vs. suburban), or store formats—such as mall vs. non-mall locations. This helps you see whether a specific competitor is disproportionately hurting your strip-center stores while leaving flagship locations untouched.
3. Zoom into state and city hotspots
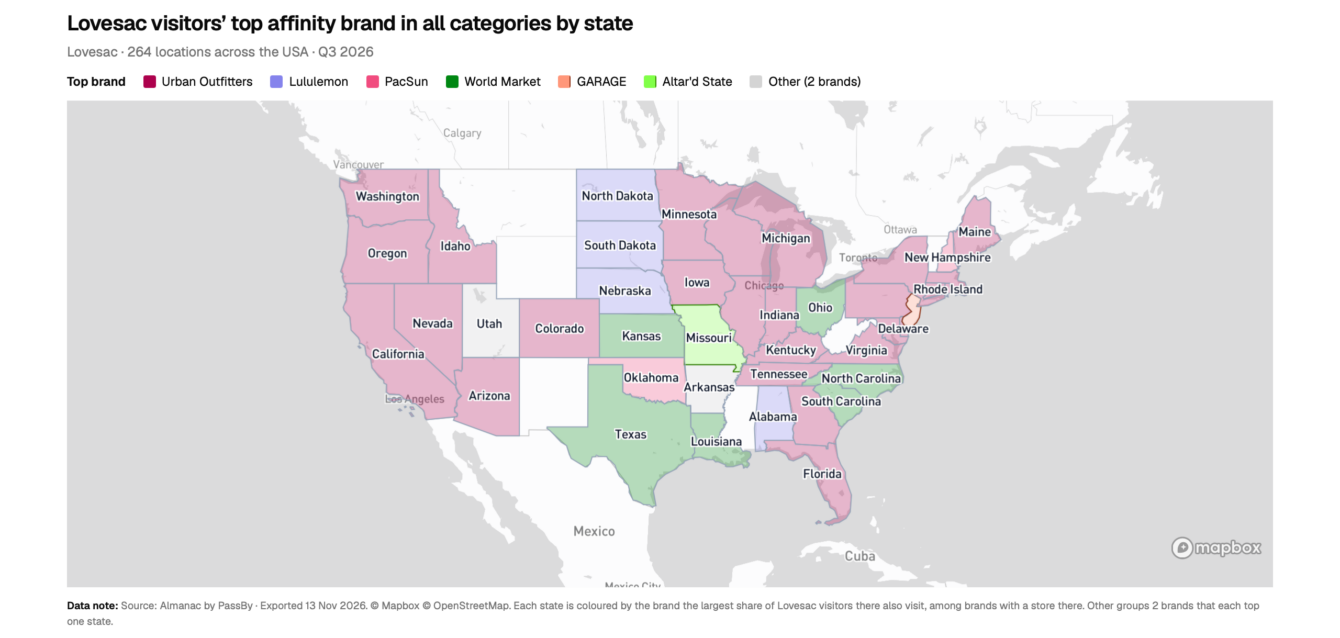
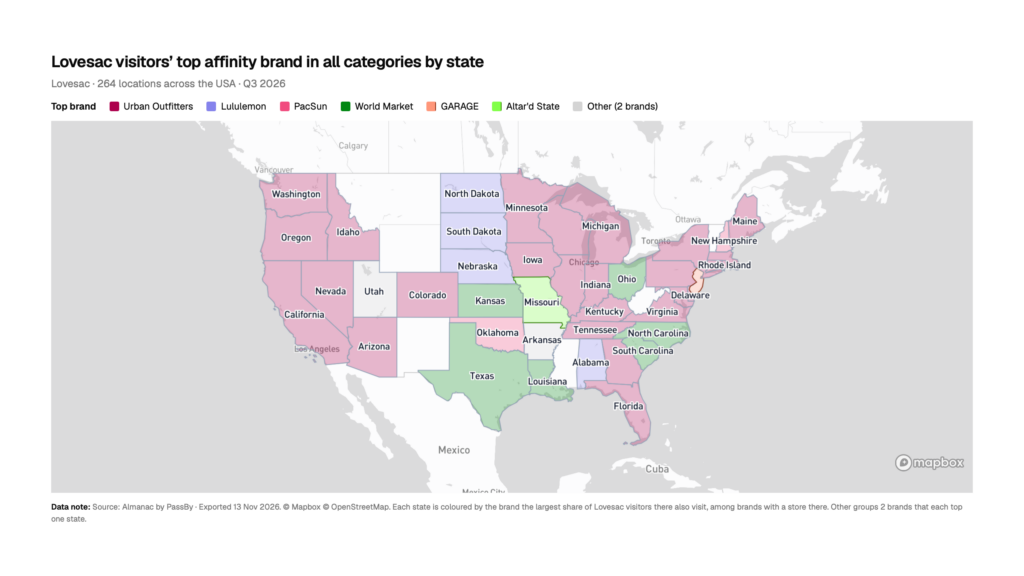
Switch between Almanac’s state and city map views to visualize geographic brand affinity. If a regional rival is aggressively capturing market share in Dallas or across the Midwest, it will stand out immediately on the map. You can download either map view as a PNG file to drop straight into regional leadership decks.
4. Export raw tables to CSV for deeper modeling
When viewing cross-shopping metrics in table format, click the CSV download button to export the clean dataset into Excel or your BI tools. From there, you can cross-reference competitor affinity against your internal store-level sales, local ad spend, or recent competitor store openings.
Skip the Manual Digging with Otto, PassBy’s AI Agent
If you need quick answers without manually slicing filters, Otto—PassBy’s AI agent—lets you query cross-shopping trends using natural language directly inside Almanac.
Otto also integrates into the tools your team already uses every day, including Claude, ChatGPT, and Microsoft Copilot. Using the Copilot integration, you can pull PassBy foot traffic data directly into your existing Excel spreadsheets and Word reports to analyze competitor cannibalization alongside internal revenue numbers.
3 Ways Retail Teams Act on Cross-Shopping Data
Once you identify which competitors are capturing your foot traffic—and where—you can turn those insights into immediate defensive moves:
- Launch targeted conquesting campaigns: Shift paid media and geo-fenced mobile ad budgets toward the specific zip codes and rival store locations showing the highest customer overlap.
- Diagnose store-level execution gaps: If one city shows unusually high defection to a competitor, investigate local factors like inventory stockouts, store cleanliness, staffing, or rival promotional pricing.
- Inform real estate and lease decisions: Use regional cross-shopping trends to evaluate whether a struggling location is suffering from broader center decline or direct cannibalization before renewing a lease.
See Who Your Customers Are Visiting Today
Stop guessing whether a traffic dip is a macro trend or a competitor winning your shoppers. Start your free 24-hour trial of Almanac—with full access to cross-shopping maps, CSV exports, and Otto, and no sales call required.
Frequently Asked Questions (FAQ)
What exactly is cross-shopping data?
Cross-shopping data reveals the other brands, store categories, and specific locations your customers visit. Instead of just knowing how many people walked through your doors, cross-shopping intelligence shows you where else your audience spends their time and money, allowing you to identify your truest competitors.
How does the 24-hour free trial work?
Our 24-hour trial gives you full access to the Almanac platform so you can test the cross-shopping tool on your own brand’s data. There are no mandatory sales calls to gatekeep your access—you can log in and start generating insights immediately.
Can I export the data to use in my internal tools?
Yes. All data tables in Almanac can be downloaded as CSV files to plug directly into Excel, your internal BI tools, or other workflows. You can also download our state and city-level heatmaps as PNG files to easily add visual data to your leadership presentations.
How do I know if a competitor is stealing traffic versus just sharing an audience?
Shared traffic is normal for complementary businesses (e.g. your customers also frequently visit a nearby grocery store). True “traffic theft” or cannibalization is identified by tracking trends over time.
How can I see if competitors are taking my store’s foot traffic?
The fastest way to find out if competitors are stealing your foot traffic is to use a market intelligence platform. Market intelligence tools like Almanac from PassBy offer data on retailers across the US to provide valuable insights on cross shopping and consumer behavior.