


Mall operators and CRE investors are sitting on one of the most data-rich environments in retail, yet many still make portfolio decisions using occupancy rates and tenant sales reports alone. Foot traffic data adds the layer that those metrics miss: how many people are actually showing up, where they come from, how long they stay, and how your property compares to every other mall in the market.
This guide covers how mall foot traffic data works in practice, what benchmarks matter, and how leasing, asset management, and marketing teams at shopping centres are using it to make better decisions.
What mall foot traffic data tells you that occupancy rates don’t
Occupancy rate is the traditional health metric for a shopping centre. If units are leased, the property is performing. But occupancy is a lagging indicator. It tells you what happened six months ago when a tenant signed or renewed. It says nothing about whether the mall is gaining or losing visitors right now, whether the tenant mix is actually drawing traffic, or whether the property is competitive within its market.
Foot traffic data operates upstream of occupancy. When a mall’s visit volume starts declining, that shows up in the traffic data months before it shows up in tenant sales, and quarters before it shows up in lease renewals or vacancy rates. By the time occupancy drops, the problem has been compounding for a year or more.
The practical difference is that foot traffic gives you a forward-looking signal on a property’s health, while occupancy gives you a backward-looking confirmation. Teams that monitor both can intervene earlier: adjusting tenant mix, renegotiating underperformers, or changing marketing strategy while there is still time to reverse a trend.
The metrics that matter for malls
Not all foot traffic metrics are equally useful for every team. Here is what matters most, broken down by who is using the data.
For asset management and ownership
Total visit volume and trends. The headline number: how many visits is the property receiving, and is it trending up or down? Year-over-year comparisons, adjusted for seasonal patterns, are the cleanest way to track this. A mall that saw 1.2 million visits in Q1 2025 and 1.15 million in Q1 2026 has a 4.2% decline that demands investigation, even if occupancy held steady.
Visit trends by format. Indoor malls, open-air centres, outlet centres, and lifestyle centres perform differently. Benchmarking your property against its format peers is more useful than comparing against all malls nationally. PassBy’s data covers all formats, so you can see how your open-air centre performs relative to other open-air centres in the same region, not against a national average dragged down by struggling enclosed malls.
Trade area health. Is the population in your catchment growing or shrinking? Are new residential developments bringing potential shoppers closer, or is a highway bypass diverting traffic away? Foot traffic trade area data, overlaid with demographic trends, answers these questions at the property level.
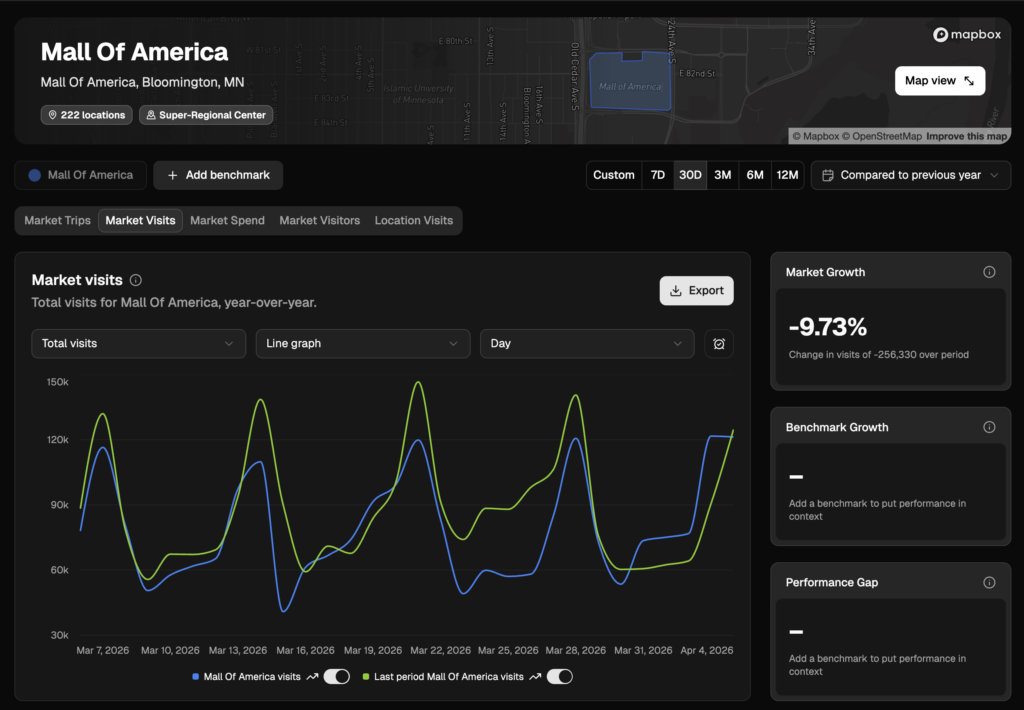
For leasing teams
Tenant-level traffic. Which tenants are drawing visitors and which are not? If an anchor tenant’s traffic is declining while the rest of the mall holds steady, that is a different problem from a mall-wide decline. Tenant-level visit data makes lease renewal conversations evidence-based rather than adversarial.
Void analysis. When a unit becomes vacant, foot traffic data helps you identify which tenant categories would perform best in that location. By analysing the demographics and shopping behaviour of visitors in the surrounding trade area, you can match vacancy to demand rather than accepting the first tenant who shows interest. For a detailed walkthrough, see our guide to retail void analysis.
Rent justification. Foot traffic data provides objective evidence for rent discussions. A mall with rising traffic and strong demographic alignment can justify premium rents. A mall where traffic has declined 15% over two years will face pushback on rent renewals regardless of what the asking rate says. Having the data in hand shifts negotiations from opinion to evidence.
Cannibalisation risk. When considering a new tenant, understanding whether their likely trade area overlaps significantly with an existing tenant of the same category prevents self-competition within the property. If a proposed coffee shop’s catchment area is 80% shared with the coffee shop on the floor above, the incremental value is limited.

For mall marketing teams
Campaign attribution. Did the summer concert series actually drive incremental visits, or did traffic increase because of seasonal patterns? Comparing visit volumes during a campaign window against a baseline period, while controlling for the same period at competitor malls, isolates the campaign’s impact from market-wide trends.
Visitor demographics for media targeting. Knowing that your weekday lunchtime visitors skew 25-34 with above-average income tells the marketing team which channels and messages to use. Knowing that your Saturday visitors are primarily families with children changes the promotional calendar entirely. Foot traffic demographic data replaces assumptions about who your visitors are with observed behaviour.
Event planning. Historical traffic patterns show which days and times have the most capacity for incremental visitors. Running an event on a Saturday when traffic is already at capacity achieves little. Running it on a Tuesday evening when the property is underutilised converts empty space into activity. Foot traffic data by hour and day of week makes this planning precise.
Using foot traffic data for mall investment decisions
For CRE investors and fund managers evaluating mall assets, foot traffic provides due diligence signals that financial statements alone cannot offer.
Acquisition due diligence. A seller’s pro forma is based on current tenant sales and lease terms. Foot traffic data provides an independent view: is the property’s visitor base growing or shrinking? How does it compare to format peers in the same market? Are the anchor tenants genuinely drawing traffic, or is the mall surviving on inertia from a trade area with no alternatives? These questions can change the investment thesis materially.
Portfolio monitoring. For funds holding multiple mall assets, monthly foot traffic reporting across the portfolio creates an early warning system. A property where visits decline for three consecutive months warrants investigation, even if rent is still being collected on time. By the time rent collection becomes a problem, the recovery options are more limited and more expensive.
Disposition timing. Knowing when a property’s traffic trajectory is deteriorating helps with exit timing. Selling a property with stable or growing traffic commands a different cap rate than selling one where the visitor trend is visibly negative. Foot traffic data lets you make that call before it becomes obvious to the market.
For more on using foot traffic data in real estate analysis, see our guide to commercial real estate data and real estate market analysis.
Mall foot traffic trends: what the data shows
PassBy’s data across 36.9 billion modelled mall visits reveals a sector that is growing at the headline level but diverging sharply by format, season, and geography.
Overall: modest growth, but not evenly distributed
Total mall foot traffic grew 0.48% year over year. That is positive, but barely. The headline masks significant variation underneath. Some formats are thriving. Others are contracting. And the gap between winners and losers is widening.
Format performance: community centres lead, super-regionals decline
The story of 2025-2026 mall traffic is a story of format divergence. Smaller, convenience-oriented formats are gaining visits while large destination malls are losing them.
Gaining traffic:
Community centres led all formats with 1.22% YoY growth, adding over 100 million visits. Neighbourhood centres grew 0.81%, and strip/convenience centres were up 0.38%. These formats benefit from proximity, routine shopping behaviour, and a tenant mix anchored around groceries, pharmacies, and everyday services.
Power centres (large open-air centres typically anchored by big-box retailers) were essentially flat at 0.15%, while regional centres managed just 0.03% growth.
Losing traffic:
The declines are concentrated in the formats that depend most on discretionary spending and destination trips. Lifestyle centres fell 0.68%. Festival and entertainment centres declined 1.03%. Super-regional centres, the large enclosed malls with multiple department store anchors, dropped 1.2%.
The sharpest decline was in outlet centres, down 3.24%. This is a notable reversal for a format that outperformed during the post-pandemic recovery period when consumers were actively seeking value. The outlet decline may reflect a broader normalisation as the value-seeking behaviour driven by inflation has eased.
The implication for operators: If you manage a super-regional or lifestyle centre, the national trend is working against you. Outperformance requires active intervention: refreshing the tenant mix, investing in experiential offerings, or repositioning the property. If you manage a community or neighbourhood centre, the tailwinds are real, but complacency is a risk since traffic growth at these formats is being driven by structural convenience, not by anything the operator is doing differently.
Seasonal pattern: holiday 2025 was down
Holiday season traffic (November-December 2025) declined 3.0% compared to the same period in 2024, with total visits falling from 7.09 billion to 6.88 billion. This is a meaningful drop for a period that typically represents the strongest traffic window of the year.
Several factors likely contributed: unseasonably warm weather in parts of the country reducing the urgency of in-store gift shopping, continued growth of online fulfilment options, and consumer caution around discretionary spending. For mall operators, the holiday decline underscores the importance of not over-indexing on Q4 performance when planning annual strategy. A property that looks healthy based on holiday traffic may be masking weakness in the other 10 months.
Regional variation: the Midwest and South are gaining, the coasts are softening
The geographic picture reveals a clear pattern: heartland states are seeing the strongest mall traffic growth while coastal metros are flat or declining.
Strongest growth: Kansas (+3.72%), Missouri (+3.37%), Iowa (+3.13%), Kentucky (+2.85%), and Oklahoma (+2.67%) led the country. Alabama, Montana, and Hawaii also posted gains above 1.5%. The common thread across these states is a combination of population stability, lower cost of living, and less e-commerce penetration than coastal markets.
Flat or declining: California was essentially flat (-0.004%). New York declined 0.42%. New Jersey fell 0.86%. Colorado dropped 0.84%. Washington DC saw the steepest decline at 2.85%, though DC’s small geographic footprint makes it more volatile than state-level data.
The implication for investors and operators: Portfolio strategy should account for these regional dynamics. A community centre in the Kansas City metro is operating in a fundamentally different demand environment than a lifestyle centre in northern New Jersey. The data does not mean coastal malls are doomed, but it does mean they face stronger headwinds and need to work harder on tenant mix, marketing, and experience to maintain traffic.
How to get started with mall foot traffic data
PassBy’s Almanac platform includes a Markets view purpose-built for mall analysis. It defines and analyses markets using retail-relevant environments, including malls, centres, clusters, and trade areas, giving teams a consistent framework for comparing properties on equal footing.
Rather than drawing arbitrary geographic boundaries, Markets structures analysis around how customers actually shop: by retail environment. This means you can compare an indoor mall against other indoor malls in the region, or benchmark a specific open-air centre against the open-air format nationally, and know the comparison is apples to apples.
For teams getting started, PassBy offers a Test & Learn tier with 90 days of Almanac access. This is enough time to run analyses across your portfolio, benchmark against competitors, and build the internal use case for ongoing access. See pricing →
FAQ
How do you measure foot traffic in a shopping mall? Mall foot traffic is measured using a combination of in-store sensors (at individual tenant entrances) and mobile location data platforms (for mall-wide and competitive analysis). Sensors give precise counts at specific doors. Platforms like PassBy model visits across the entire property and its competitors using aggregated mobile device signals. Most sophisticated mall operators use both. For a full comparison of methods, see how to measure foot traffic.
Is mall foot traffic increasing or decreasing? Overall mall traffic grew 0.48% year over year according to PassBy data, but the picture varies dramatically by format. Community centres grew 1.22% and neighbourhood centres grew 0.81%, while super-regional centres declined 1.2% and outlet centres fell 3.24%. The national average is nearly meaningless for individual properties. What matters is how your specific property performs relative to its format peers in its market.
What is good foot traffic for a mall? There is no universal benchmark because traffic varies enormously by format, size, location, and market. A Class A regional mall might see millions of visits per year. A neighbourhood strip centre might see tens of thousands. The more useful question is: how does your property’s traffic compare to similar properties in the same market, and is it trending up or down? PassBy’s benchmarking tools answer this by comparing your property against format and market peers.
How can malls increase foot traffic? The most effective strategies depend on why traffic is declining. If the trade area demographics have shifted, the tenant mix may need updating. If traffic is strong but concentrated in specific hours, extending operating hours or running off-peak events captures incremental visits. If competitors are gaining share, understanding what they are doing differently (through competitive foot traffic benchmarking) informs the response. Data should diagnose the problem before you choose the intervention.
What foot traffic data do mall investors look at? Investors typically focus on: total visit trends (YoY), visits per square foot, trade area demographics, competitive position within the market, and tenant-level traffic for anchor evaluation. Forward-looking indicators like predictive visit forecasts and trade area population trends are increasingly used in underwriting models.