


White space analysis tells you where gaps exist in your store network. Market opportunity analysis tells you how big those gaps are and which ones are worth filling first.
The distinction matters because not all opportunities are equal. A market with unserved demand for your brand might support one store or five. The trade area might contain 50,000 target customers or 500,000. The competitive environment might be wide open or one new entrant away from saturation. Market opportunity analysis quantifies these differences so your expansion capital goes to the markets with the highest return potential, not just the nearest available gap.
This guide covers how retail brands size market opportunity, the data that feeds the analysis, and how to build a ranked pipeline of expansion targets that your real estate team can execute against.
What market opportunity analysis includes
Market opportunity analysis for retail combines four assessments into a single view of a market’s potential for your brand.
Demand sizing
How many of your target customers exist in the market, and how much are they likely to spend in your category?
Population and demographic fit. Start with the total population in the market, then filter by your target demographic criteria (income, age, household type, education). The result is your addressable population: the number of people in the market who match your customer profile. PassBy’s demographic data provides this at the trade area level, not just the metro level, so you can size demand at the granularity where store-level decisions are made.
Category spending. How much does the addressable population spend in your category? PassBy indexes over $1 trillion in consumer spend data, which means you can estimate the total category spend within a trade area rather than relying on national averages applied to local populations. A market where target customers spend 20% above the national average on your category has a meaningfully different opportunity size than one where they spend 20% below.
Psychographic demand signals. Beyond demographics and spend, behavioral signals indicate whether the population actively seeks your category. Trade area visitors who index highly on relevant lifestyle categories (fitness for activewear, dining out for restaurants, home improvement for hardware) represent stronger demand than demographics alone would suggest.
Supply assessment
How much of that demand is already being served, and by whom?
Your own coverage. How many of your stores currently serve this market, and what percentage of the addressable population falls within their trade areas? A market where your existing stores cover 30% of the addressable population has 70% unserved — that is the opportunity. A market where your stores cover 85% has limited remaining opportunity regardless of the total demand.
Competitor saturation. How many competitors operate in the market, and how are they performing? A market with strong demand and three healthy competitors is a different opportunity than one with the same demand and one struggling competitor. PassBy’s competitive benchmarking shows visit trends for every competitor location, so you can assess not just how many competitors exist but whether they are gaining or losing ground.
Unmet demand calculation. Total category demand minus demand currently served by your stores and competitors equals unmet demand. This is the theoretical ceiling for a new store. The practical ceiling is lower (you will not capture 100% of unmet demand), but the calculation provides the starting point for revenue modeling.
Competitive dynamics
Beyond counting competitors, understanding how the competitive environment is evolving determines whether an opportunity is growing or shrinking.
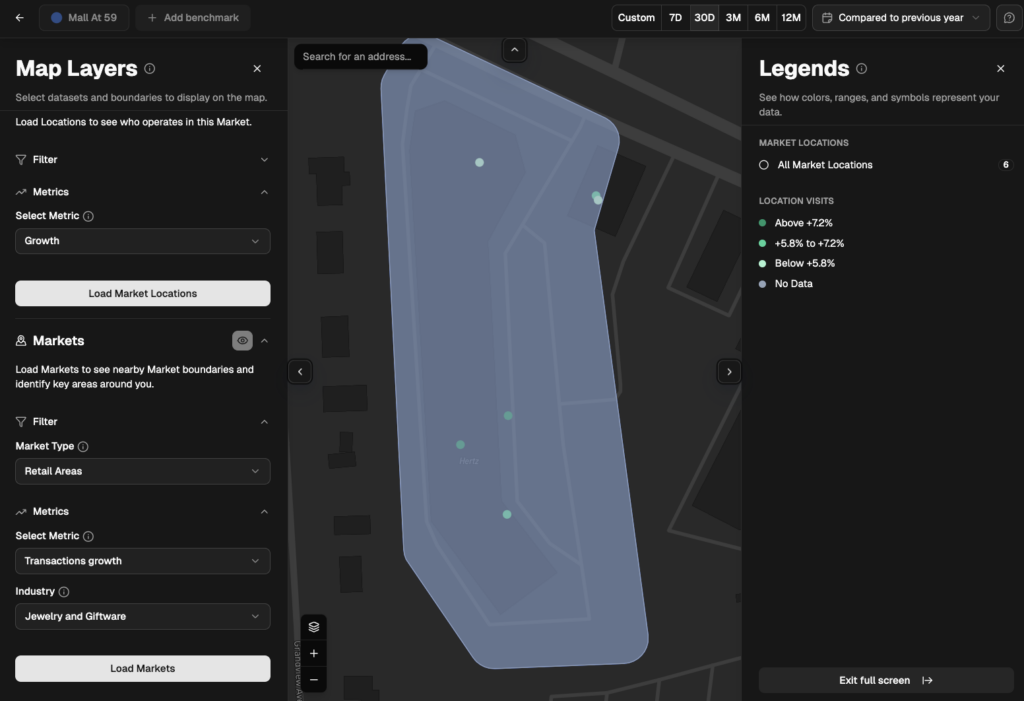
Competitor trajectory. A market where competitors are closing stores or losing traffic has a growing opportunity. One where competitors are expanding and gaining traffic has a shrinking one. PassBy’s historical foot traffic data shows competitive trajectory over 5+ years, revealing whether the window of opportunity is opening or closing.
Competitor vulnerability. A competitor with declining traffic, poor demographic alignment, or a weakening brand presence is vulnerable to a well-positioned new entrant. Competitive benchmarking data identifies these vulnerabilities at the individual store level, not just the brand level. A competitor might be strong nationally but weak in the specific market you are evaluating.
Entry barriers. Some markets have structural barriers that limit new entry: restrictive zoning, limited retail real estate, exclusive lease agreements in key centers, or dominant incumbents with loyal customer bases. These barriers reduce the practical opportunity even when the demand analysis looks strong.
Financial modeling
The demand, supply, and competitive assessments feed into a financial model that projects whether a new store in the market can meet your return thresholds.
Revenue projection. Estimated unmet demand x your expected capture rate x average transaction value = projected revenue. Foot traffic data provides the demand input. Your historical data from comparable stores provides the capture rate and ATV assumptions. The projection should use a range (conservative, base, optimistic) rather than a single number.
Cost structure. Rent, build-out, staffing, marketing, and operating costs for the specific market. These vary significantly by geography: a store in Austin has a different cost structure than one in Des Moines. The financial model must reflect local costs, not national averages.
Return calculation. Projected revenue minus projected costs, measured against your minimum return threshold (typically expressed as a required payback period, minimum EBITDA margin, or target ROI). Markets that pass the financial filter with a margin of safety move to the pipeline. Markets that barely pass are higher-risk and should be deprioritized or validated with a pop-up test.
How to run a market opportunity analysis
Step 1: Define your success criteria
Before analyzing any market, establish the quantitative thresholds a market must meet. These typically include: minimum addressable population, minimum category spend density, maximum competitive saturation ratio, minimum projected first-year revenue, and maximum acceptable cannibalization of existing stores. These thresholds create an objective filter that prevents emotional attachment to markets that do not meet the requirements.
Step 2: Screen and score markets
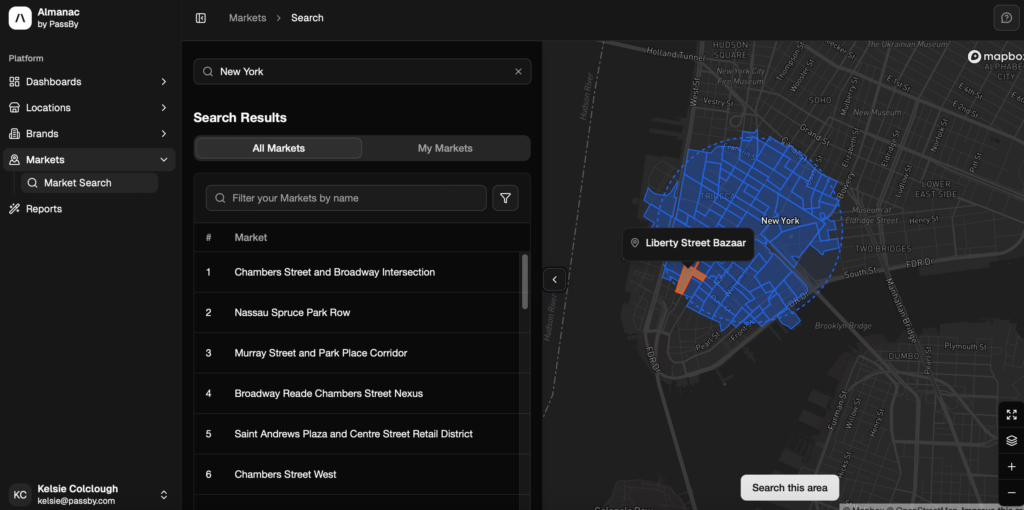
Using PassBy’s data, score markets across your target geography on each component of the opportunity analysis: demand sizing, supply gap, competitive dynamics, and financial viability. Almanac’s Markets view lets you compare retail environments systematically rather than evaluating each market in isolation.
The scoring should weight components based on what predicts success for your brand. A brand whose performance correlates most strongly with demographic fit should weight demand sizing heavily. A brand whose performance is most sensitive to competition should weight the supply assessment.
Step 3: Rank and tier
Sort the scored markets into tiers:
Tier 1: Enter now. Markets with strong demand, limited competition, favorable trajectory, and clear financial viability. These should move immediately to site selection.
Tier 2: Monitor and prepare. Markets with strong demand but higher competition, or strong demand with a single viability concern (e.g., limited available real estate). Keep these on the pipeline and re-evaluate quarterly.
Tier 3: Long-term watch. Markets with emerging demand or early-stage development that may become Tier 1 or 2 in 2-3 years. Track demographic growth and competitive changes.
Step 4: Transition to site selection
For Tier 1 markets, the output of market opportunity analysis becomes the input to site selection. The demand sizing, competitive landscape, and financial parameters carry forward into the evaluation of specific sites within the market. See our site selection guide and site selection criteria for the next stage of the process.
How market opportunity analysis connects to other expansion decisions
Market opportunity analysis does not operate in isolation. It connects to every other expansion planning discipline.
White space analysis identifies where gaps exist. Market opportunity analysis quantifies how large those gaps are. The two processes are complementary: white space surfaces the candidates, opportunity analysis ranks them. See white space analysis.
Cannibalization analysis ensures that a market opportunity is genuinely incremental. A market that scores highly on demand and supply gap may still be a poor target if a new store would cannibalize an existing location. See cannibalization guide.
Portfolio optimization uses market opportunity analysis in reverse: comparing the opportunity in markets where you currently operate against the opportunity in markets where you do not. If your existing stores are in markets where the opportunity is declining while Tier 1 white space markets are growing, the portfolio strategy should shift capital accordingly. See portfolio optimization (coming soon).
Site selection takes the ranked market list and finds specific locations within each market. See site selection guide.
Category-specific considerations
QSR and restaurants. Market opportunity for QSR is measured at the corridor and intersection level, not the metro level. A single metro might contain 50 micro-opportunities (individual intersections or corridors that could each support a location). The daypart dimension is critical: a corridor with strong lunch traffic represents a different opportunity than one with strong dinner traffic. See restaurant site selection.
Apparel. Market opportunity for apparel is heavily influenced by psychographic fit. Two markets with identical population and income can have completely different opportunity sizes if one population indexes high on fashion and the other does not. Spend data is especially important: apparel spending varies more by psychographic profile than by income alone. See apparel foot traffic data.
Grocery. Market opportunity for grocery is driven by household density within a tight radius and competitive saturation. Grocery markets can flip from underserved to oversaturated with a single new entrant because trade areas are small and anchor effects are large.
Pharmacy. The current wave of pharmacy closures has created a unique market opportunity dynamic: displacement demand. Markets where CVS or Walgreens have closed locations contain customers who need a pharmacy but no longer have a convenient option. This demand is time-sensitive and represents a near-term opportunity for competitors who can move quickly.
Getting started
PassBy’s Almanac platform provides the data layers that power market opportunity analysis: demographic and psychographic profiling, consumer spend data, competitive benchmarking with traffic trends, trade area analysis, and market-level comparisons. The Markets view lets you screen, score, and rank opportunities across any geography.
For teams building their first market opportunity model, the Test & Learn tier provides 90 days of Almanac access. See pricing →
FAQ
What is market opportunity analysis in retail? Market opportunity analysis is the process of quantifying the revenue potential of a geographic market for your brand. It combines demand sizing (how many target customers exist and how much they spend), supply assessment (how much of that demand is already served), competitive dynamics (who else operates and how they are performing), and financial modeling (whether a new store can meet return thresholds).
How do you size a retail market opportunity? Start with the addressable population (people matching your target demographic in the trade area), multiply by category spending per capita to estimate total demand, subtract the demand currently served by your stores and competitors, and the remainder is the unmet opportunity. Apply your expected capture rate to project revenue, then validate against your financial thresholds.
What’s the difference between white space analysis and market opportunity analysis? White space analysis identifies where gaps exist in your coverage. Market opportunity analysis quantifies how large those gaps are and whether they are worth filling. White space is qualitative (gap or no gap). Market opportunity is quantitative (how big, how competitive, how profitable). Both are necessary for data-driven expansion planning.
How often should you reassess market opportunities? Annually at minimum as part of strategic planning. Markets change: populations shift, competitors open or close, consumer spending patterns evolve. A market that was Tier 2 last year may be Tier 1 today if a competitor exited or new residential development increased the addressable population.
What data do you need for market opportunity analysis? Demographic data, psychographic profiles, consumer spend data, competitor locations and foot traffic trends, trade area boundaries, and financial benchmarks from your existing stores. PassBy provides all of these through Almanac, with the spend data layer being a particular differentiator: it indexes over $1 trillion in consumer transactions to estimate category spending at the trade area level.