


Apparel is one of the most structurally divided categories in physical retail. The same foot traffic data that shows activewear brands opening stores at an aggressive pace also shows legacy department stores and mall-based specialty retailers losing visits year over year. The category is not declining uniformly. It is fracturing, and the foot traffic data reveals exactly where the fractures are.
This guide breaks down how apparel foot traffic is performing across segments, what the seasonal and format patterns look like, and how store ops, real estate, and marketing teams at fashion retailers can use the data.
The state of apparel foot traffic
The apparel category is defined by divergence, and PassBy’s data across 50,833 stores and 8.7 billion visits confirms it. The headline: overall apparel and clothing foot traffic declined 1.76% year over year. But that average masks a category pulling in opposite directions.
The segment picture
PassBy data across six related segments reveals where the traffic is going and where it is not.
Accessories and jewellery (+1.47%) is the only apparel-adjacent segment gaining traffic. This aligns with the broader industry trend of consumers investing in lasting accessories and the self-gifting behaviour noted in McKinsey’s State of Fashion report. With 7,950 stores generating over 619 million visits, the segment is small but healthy.
Department stores (+0.20%) are essentially flat, with 5.48 billion visits across 9,652 locations. This is better than many expected, and it masks significant variation between winners (Nordstrom Rack, well-positioned Macy’s locations) and losers (struggling mall anchors). The near-zero growth suggests stabilisation rather than recovery.
Sporting goods (-0.92%) declined modestly, losing roughly 19 million visits across 6,114 stores. This segment sits at the intersection of activewear and general retail, and its mild decline suggests that while branded activewear stores are capturing enthusiasm, the broader sporting goods channel is giving back share.
Apparel and clothing (-1.04%) is the core segment, and its 1% decline across 31,916 stores and nearly 6 billion visits is significant at scale. This represents roughly 63 million fewer store visits year over year, a meaningful loss of opportunity for conversion.
Beauty and cosmetics (-1.12%) declined slightly, an interesting counterpoint to the narrative of beauty as a growth category. The data suggests that while destination beauty retailers like Sephora may be performing well individually, the broader category including drugstore beauty, salon chains, and smaller independents is softening.
Footwear (-4.60%) saw the sharpest decline of any segment, losing over 100 million visits across nearly 11,000 stores. This is a notable deterioration that likely reflects both the shift of sneaker culture toward online drops and resale, and the specific struggles of brands in the data below.
The brands that tell the story
The brand-level data is where the divergence becomes vivid. The fastest-growing and fastest-declining apparel brands in PassBy’s dataset are operating in completely different realities.
Gaining traffic:
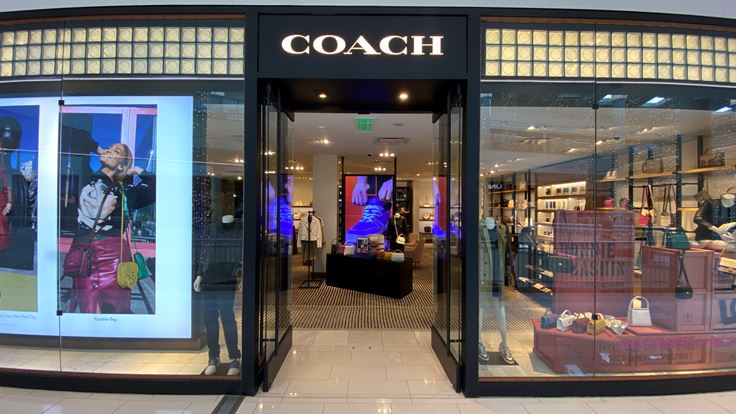
Coach leads all apparel brands with a remarkable 20.14% same-store traffic increase, reflecting the brand’s successful repositioning under Tapestry from accessible luxury toward a more aspirational, younger-skewing identity. This is not a new-store effect. This is existing stores drawing dramatically more visitors.
PacSun (+7.10%) is thriving by capturing the Gen Z consumer who wants trend-forward, culture-adjacent fashion at an accessible price. With 62 million visits, PacSun has become one of the highest-traffic youth apparel retailers in the country.
J. Crew Factory (+6.69%), Eddie Bauer (+8.67%), and Fabletics (+5.16%) round out the growth leaders. The common thread is clear brand identity and a value proposition that justifies the trip. J. Crew Factory offers heritage-adjacent style at outlet prices. Eddie Bauer owns the outdoor lifestyle lane. Fabletics converts its digital-first membership model into physical retail traffic.
Akira (+12.03%), Grunt Style (+8.91%), Sperry (+9.74%), and Lacoste (+4.73%) are smaller brands with outsized growth, suggesting niche positioning and loyal customer bases are outperforming broad-market strategies.
Losing traffic:
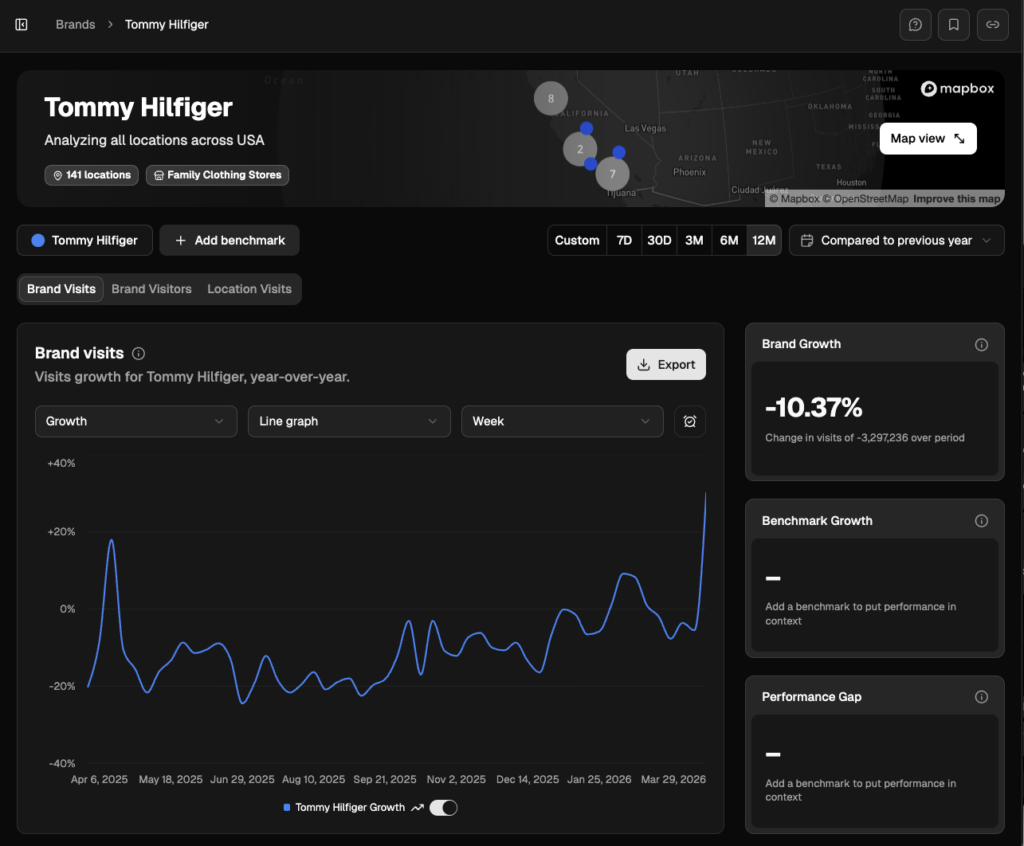
The decline list tells an equally sharp story. Tommy Hilfiger (-10.43%) and PUMA (-9.85%) are large-scale brands losing significant traffic, with Tommy shedding over 3.3 million visits and PUMA losing 2.4 million. Both face the challenge of competing against brands with stronger cultural momentum and younger consumer engagement.
Bergdorf Goodman (-10.14%) reflects the broader pressure on upper-luxury physical retail, where even iconic names struggle to maintain visit volumes as the luxury consumer becomes more selective and digitally engaged.
Bonobos (-9.88%) and SuitSupply (-9.82%) suggest that the digitally-native menswear brands that moved into physical retail are finding it harder to sustain in-store traffic as the novelty fades and the workwear recovery plateaus.
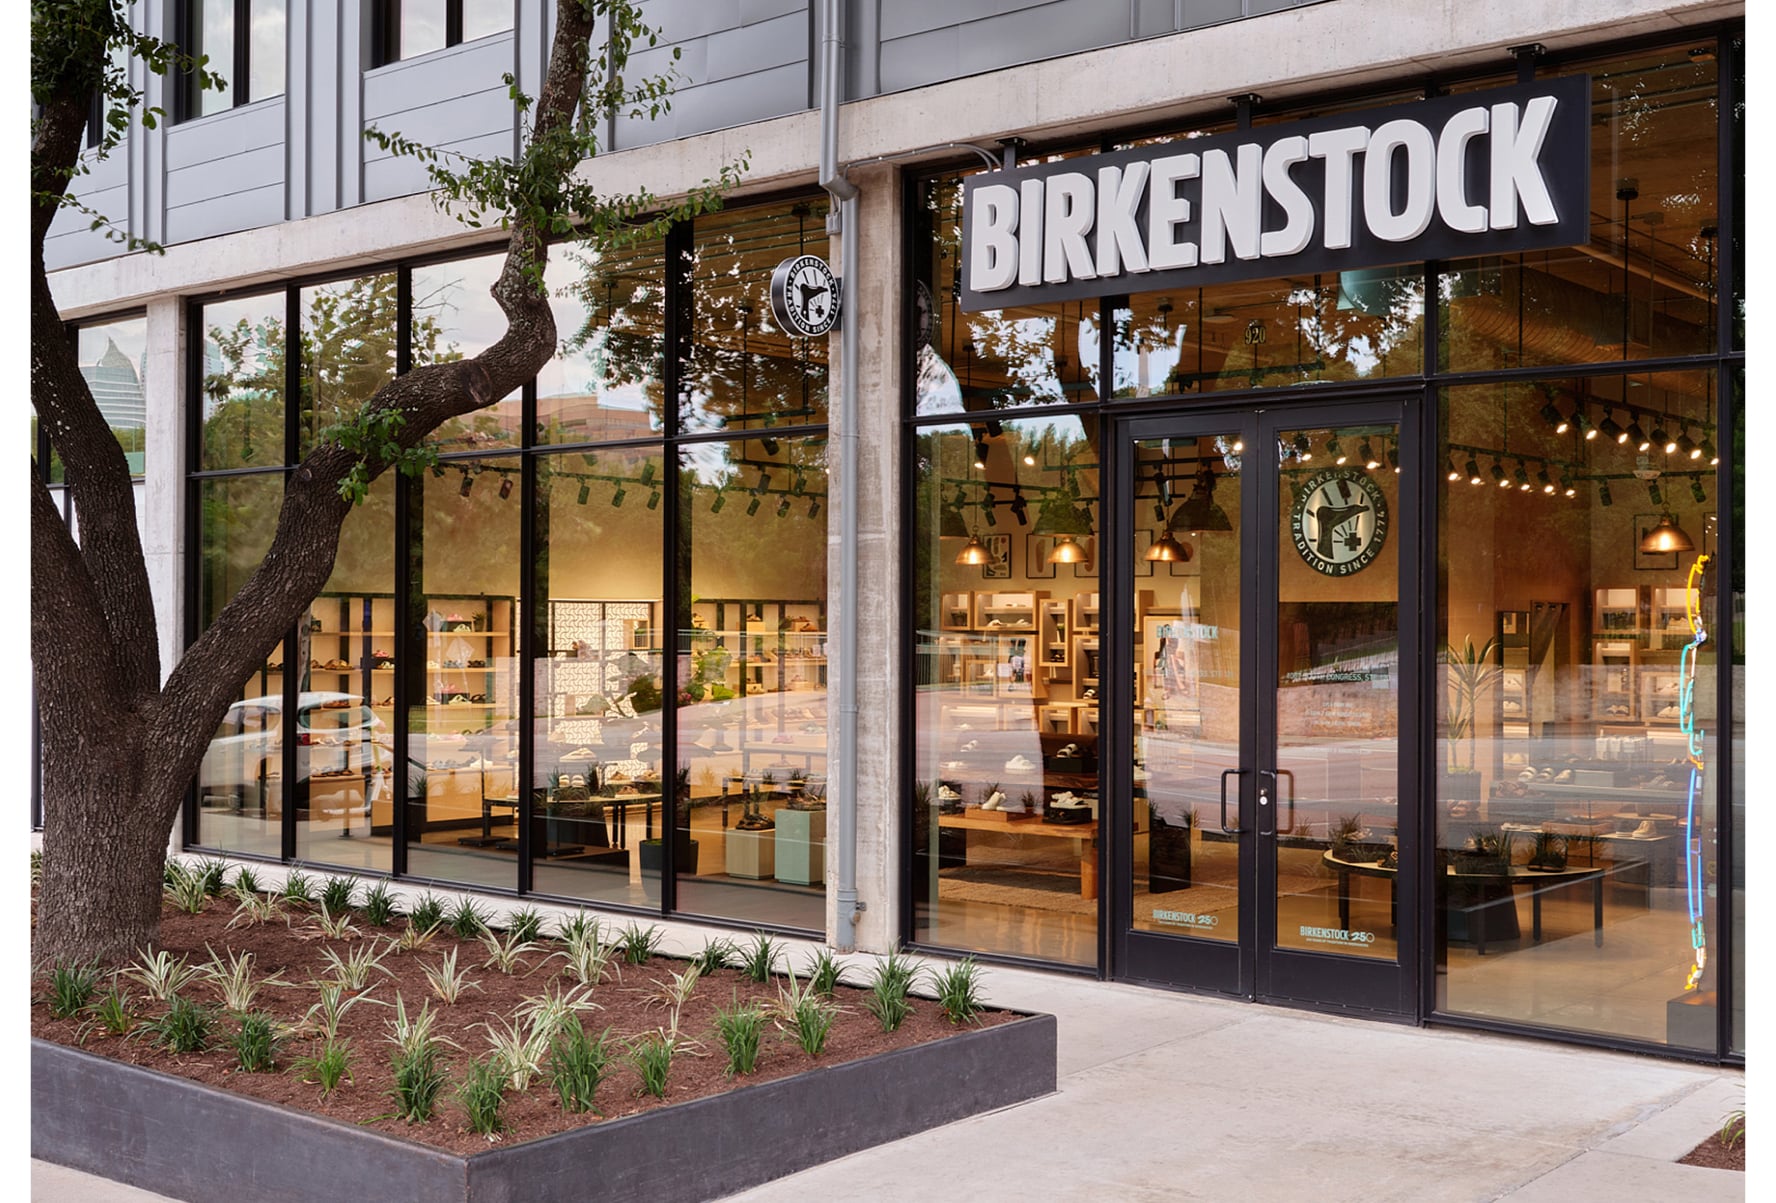
Birkenstock (-9.29%) is a surprising decliner given the brand’s cultural moment, but the data captures physical retail visits specifically, and Birkenstock’s growth may be concentrated in wholesale and online channels rather than branded stores.
FILA (-9.60%) and Casual Male XL (-10.20%) are niche decliners facing different structural challenges: FILA’s retro trend cycle may be fading, while Casual Male faces the broader consolidation of specialty sizing retail.
Seasonal patterns in apparel foot traffic
PassBy’s monthly visit data across apparel reveals the category’s pronounced seasonality with precision.
Back-to-school (late July through September). This is the single largest apparel traffic event of the year. PassBy data shows August 2025 at 860 million visits, a 32% spike above June’s 718 million. The surge begins building in July (780 million) and remains elevated through September (643 million) before dropping sharply in October. The back-to-school window is narrow and intense: staffing and inventory need to be in position by mid-July, not the start of August. Brands that time their floor readiness to the data rather than the calendar gain a measurable edge.
Year over year, August 2025 (860 million) was down slightly from August 2024 (874 million), a 1.6% decline that tracks with the category’s overall softening. But the seasonal shape held: August remains the apparel category’s single biggest month outside of the holiday season.
Holiday season (November through December). December is the highest-traffic month for apparel at over 1 billion visits in both years. November (821 million in 2025 vs 854 million in 2024) reflects the continuing pull-forward of holiday shopping into Black Friday and earlier promotional events. The December decline from 1.08 billion in 2024 to 1.01 billion in 2025 is a 7% drop, consistent with the broader mall holiday traffic decline of 3% and suggesting that apparel may be feeling the holiday softening more acutely than other categories.
The spring transition (March through May). March and May both hover around 700-770 million visits, forming a secondary plateau. March 2025 (703 million) was the first significant uptick after the post-holiday dip in January and February. May 2025 (769 million) was actually the strongest spring month, likely driven by warm-weather wardrobe refreshes and pre-summer shopping.
The summer dip and January trough. January and February are consistently the weakest months, with February 2025 at just 539 million visits, roughly half of December’s volume. This is the window where marketing investment has the highest potential for incremental impact because there is the most capacity to fill. June (718 million) dips below May, confirming the pattern of consumers shifting spending toward travel and dining as summer begins.
How apparel teams use foot traffic data
Store operations
Staffing to seasonal spikes. Apparel’s pronounced seasonality means staffing models need to flex dramatically. A store that needs 12 floor staff on a back-to-school Saturday might need 5 on a Tuesday in February. Hourly foot traffic data by location makes this scheduling precise rather than intuitive.
Fitting room conversion. For apparel specifically, the fitting room is the key conversion point. Stores where visitors use the fitting room convert at dramatically higher rates than those where they do not. While foot traffic data does not directly measure fitting room usage, correlating overall traffic patterns with transaction data by hour and day identifies when conversion drops, suggesting the fitting room experience (availability, staffing, wait time) may be the bottleneck.
New product drop timing. Fast fashion and streetwear brands that rely on product drops to drive traffic can use historical visit data to identify the optimal day and time. If Wednesday afternoons consistently show the highest visit-to-purchase conversion for your core demographic, that is when the drop should land.
Real estate and site selection
Format matching. An activewear brand opening in a lifestyle centre where the visitor demographic skews health-conscious and affluent is a different proposition from the same brand opening in a super-regional mall where the demographic is broader. Foot traffic demographic data for candidate sites helps match format to brand positioning.
Co-tenancy analysis. Apparel benefits significantly from adjacency effects. A women’s fashion retailer next to a strong beauty anchor (Sephora, Ulta) benefits from cross-shopping. A streetwear brand near a sneaker store captures overlapping traffic. Foot traffic cross-visitation data reveals which co-tenants drive the most visitor overlap, informing lease negotiations and site prioritisation.
Cannibalisation in DTC expansion. As DTC apparel brands expand their physical footprint, the risk of new stores cannibalising existing ones increases. Trade area overlap analysis shows how much of a new store’s projected traffic would come from an existing location’s catchment vs genuinely new customers. For brands like Alo Yoga opening multiple stores in the same metro, this analysis prevents the expansion from eroding per-store economics.
For a detailed guide to site selection methodology, see retail site selection.
Marketing
Campaign attribution by store. An apparel brand running a regional Instagram campaign can measure the foot traffic lift at stores within the campaign’s geographic target vs stores outside it. This isolates the campaign’s physical-world impact from organic traffic patterns and seasonal trends.
Audience profiling for media planning. Foot traffic demographic data reveals who actually visits your stores, which may differ from who your media plan targets. If your visitor base skews older or more affluent than your assumed target, the media plan needs adjusting. Psychographic data (lifestyle interests, media consumption) enables lookalike audience targeting on digital channels based on the characteristics of your actual store visitors.
Competitor traffic monitoring. Tracking foot traffic to competitor stores in your trade areas provides an early warning system. If a competitor is gaining visits in a market where you are flat, they may be doing something (a new campaign, a store refresh, a promotional strategy) worth understanding and responding to.
For more on using foot traffic data in marketing, see retail marketing strategies.
The apparel brands to watch
PassBy publishes regular reports on the fastest-growing retail brands based on foot traffic data. In the apparel space, the stories worth following include:
Challenger activewear brands (Alo Yoga, Vuori, On Running) that are expanding aggressively with a physical retail strategy built on community and experience rather than discount-driven traffic.
Off-price resilience (TJ Maxx, Ross, Burlington) where consistent traffic patterns and the treasure-hunt model continue to perform regardless of economic cycle.
Footwear specialists where brands like Hoka and On Running are translating running culture into physical retail foot traffic.
For the latest rankings and trend data, see our reports: Top Fast-Growing Retail Brands 2026, Top Footwear Brands 2026, and Top Luxury Fashion Retailers.
Getting started with apparel foot traffic data
PassBy covers 8,000+ US retail brands across every apparel segment, from activewear and fast fashion to luxury and off-price. Almanac provides visit trends, competitive benchmarking, trade area analysis, and demographic profiling for any apparel location in the country.
For apparel teams evaluating foot traffic data for the first time, PassBy offers a Test & Learn tier with 90 days of Almanac access. Enough time to benchmark your stores, analyse competitors, and build the internal case for data-driven decision making. See pricing →
FAQ
How is apparel foot traffic performing in 2026? Overall apparel foot traffic declined 1.76% year over year according to PassBy data across 50,833 stores. But performance varies dramatically by segment: accessories and jewellery grew 1.47%, department stores were essentially flat at +0.20%, while footwear dropped 4.60%. At the brand level, Coach surged 20.14% while Tommy Hilfiger declined 10.43%. The category is not declining uniformly; it is diverging.
What is the busiest season for apparel foot traffic? December is the highest-traffic month at over 1 billion visits. August is the second peak at 860 million visits, driven by back-to-school. February is the lowest at 539 million visits, roughly half of December’s volume. The spring months (March through May) form a secondary plateau around 700-770 million visits. These seasonal patterns are consistent year over year but the peaks are softening: December 2025 was down 7% from December 2024.
How do activewear brands grow foot traffic so fast? The fastest-growing activewear brands combine strategic store placement in affluent, health-conscious trade areas with community-driven marketing (events, influencer partnerships, wellness programmes). The physical stores function as brand billboards as much as transaction points. Foot traffic data helps these brands select sites where the visitor demographics align with their target audience. See our Alo Yoga analysis for a detailed case study.
How does foot traffic data help with apparel site selection? Foot traffic data reveals the visitor volume, demographic profile, and competitive landscape of a candidate site before you commit to a lease. For apparel brands, demographic alignment (income, age, lifestyle) is particularly important because fashion purchase decisions are heavily influenced by customer profile. Trade area analysis also identifies cannibalisation risk when opening a new store near an existing location. See retail site selection.
Can foot traffic data measure the impact of a fashion marketing campaign? Yes. By comparing store visit volumes during a campaign window against a baseline period and controlling for seasonality and competitor trends, foot traffic data isolates the incremental visits a campaign generated. This is particularly valuable for apparel brands where the path from digital impression to physical store visit is difficult to track through traditional attribution.