We’re excited to announce the launch of Places 2.0, a major update to one of the most-used sections of the Almanac platform.
This release is about one thing: helping you find answers faster.
Over the past several months, we’ve reviewed dozens of feature requests and user interviews. The common theme was clear – Places was powerful, but clunky. Users were switching dates repeatedly, scrolling through long pages of charts, and working around a rigid benchmarking system that didn’t reflect how they operate.
Places 2.0 addresses all of that with a clean, restructured interface and a more flexible foundation for comparative analytics.
Let’s walk through what’s new.
A single date picker that applies everywhere
One of the most consistent requests we heard was around the date picker. In the original version of Places, each analytics card required its own date setting. This led to repetitive workflows and increased room for error.
Now, Places 2.0 introduces a single, global date picker that governs all analytics on the page. Once you set your time range—whether it’s week-on-week, year-on-year, or a custom period—it applies to every chart and comparison view. You can toggle between absolute and relative dates, and presets are available to make standard timeframes even easier to select.
No more re-applying filters. Just set once and explore freely.
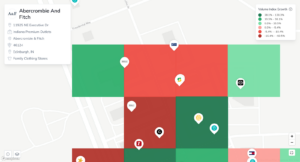
Benchmarking built around your competitive reality
The original benchmarking logic in Places was one-size-fits-all. But competitive context is rarely that simple—especially in retail, where stores can be compared across regions, centres, or head-to-head with a specific rival.
Places 2.0 introduces a fully flexible benchmarking system. You can now choose from:
- A custom competitive set made up of specific retailers you define
- The retail centre average, useful for understanding mall or strip performance
- A single competitor, for direct comparisons
Each of these benchmark types can be applied across any date range and visualised in just a few clicks. This lets you compare the way you actually think about your competitive landscape—and share those insights more easily with stakeholders.
Analytics now grouped into clean, tabbed sections
Previously, the Places section surfaced all metrics in a long scrollable list. While comprehensive, it made navigating between different types of analysis more time-consuming than it needed to be.
In Places 2.0, analytics are now grouped into tabbed sections:
- Store Visits
- Store Visitors
- Trade Area
Each section loads quickly and stays tied to the global date and benchmark settings. This structure significantly reduces scroll fatigue and helps users find what they need with far less friction.
Two new tabs – Cross-Shopping and Psychographics – will also be added to the Store Visitors section in the coming weeks.
A better way to share exact views
Another big improvement is the ability to share deep links. With the new “Copy link” button, you can now send teammates an exact view of your current dashboard, including the date range, visualisation type, selected benchmark, and comparison mode.
This allows teams to collaborate faster, without having to replicate filter logic manually. Whether you’re preparing a report, discussing store performance, or tracking campaign impact, you can now get everyone on the same page—literally.
More flexible visualisations and exports
Places 2.0 also includes small but important user-experience improvements. You can now:
- Toggle between chart types (e.g. line, bar, table) without leaving the page
- Adjust comparison logic on the fly
- Export any view as a CSV or image, as before
These controls are located directly above each visual, making the interface faster to navigate for both casual users and power analysts.
A note on trade area data
Trade area analytics have also been upgraded as part of this release. While the visual interface and comparisons are now in line with the rest of the platform, the underlying data still follows a quarterly update cadence.
By default, users will see the most recent quarter. If you’re interested in exploring historical trends across multiple quarters, reach out to your Account Manager and they can unlock extended access on request.
What’s next
Places 2.0 lays the groundwork for a more flexible, insight-driven analytics experience across the board. Coming soon:
- Cross-shopping data to understand overlapping audiences between retailers
- Psychographic overlays to add depth to visitor profiles
- Preset benchmarks for common categories like fashion, footwear, and department stores
We’re also continuing to refine speed and accessibility across the platform. If you have feedback, ideas, or issues to flag, we’d love to hear from you.
Try it now
You can watch the video on these features here.
Places 2.0 is now live for all pass_by customers. Head to Analytics → Places to explore the updates and see how quickly you can move from data to decisions.
Thanks to everyone who gave feedback and helped shape this release. As always, we’re building for—and with—you.