Release date: Tuesday 28th November 2023
↳ Highlights
- Visualize the core trade area of your stores with Trade Area analysis
- Analyze the consumer habits of visitors with Visitor Cross-Shopping
- Generate a Tenant Finder report tailored to your retail center
↳ Visualize the core trade area of your stores
With the new Trade Area Analysis tool, you can visualize the core trade area of your stores. The analytic displays three trade areas on the map, allowing you to see the distance that customers travel to visit your locations.
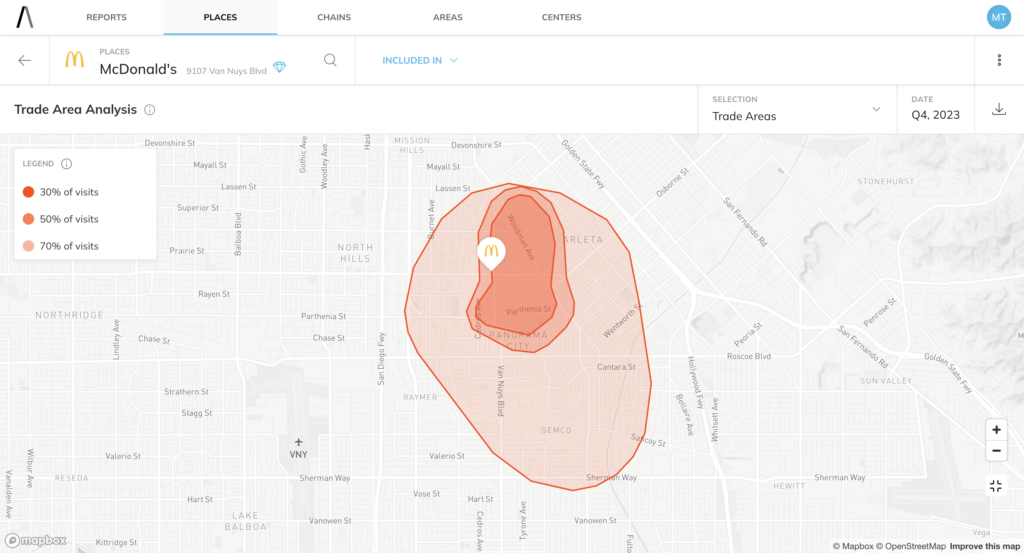
This data is key for real estate decisions. Knowing the trade area of existing sites is essential to avoid the risk of store cannibalization. By ensuring new sites are located outside of existing trade areas, you can reduce the risk of pulling trade from established stores.
The analytic works by looking at the customers who have visited a place in the last 12 months. Based on the home location of visitors, and weighted by foot traffic volume, the visualization displays the trade areas that account for 30%, 50% and 70% of foot traffic.
Beyond real estate, trade areas can be used to identify and analyze destination stores; run market analysis on local competitors; and plan the location of marketing campaigns.
The trade area analysis is complemented by a new Home ZIP codes visualization, which displays the percentage of visitors which originate from each ZIP code.
Read the Trade Analysis Help Center guide →
↳ Analyze the consumer habits of visitors
Discover your visitors’ consumer behavior with the new Visitor Cross-Shopping analytic. This new tool lets you identify the retailers that are most popular among your visitors.
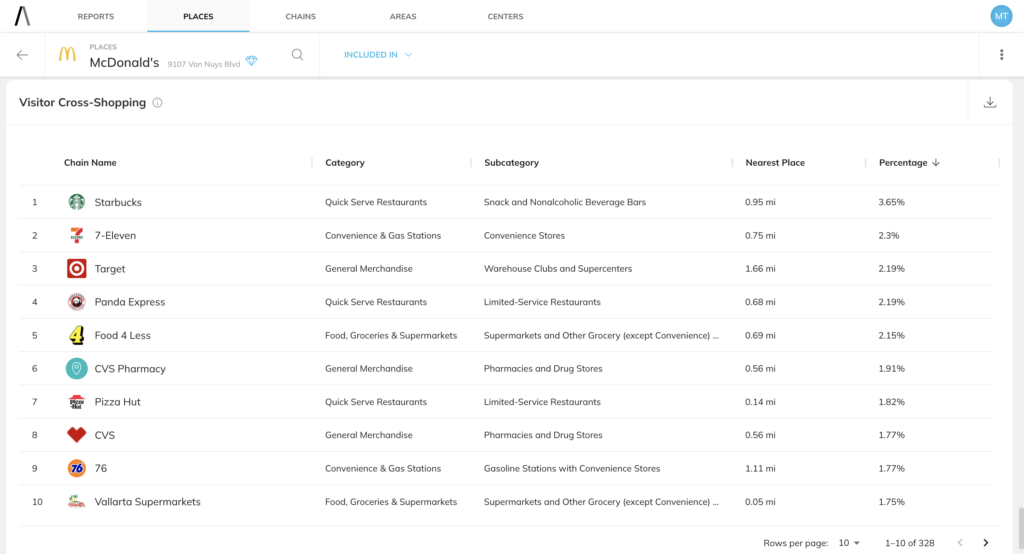
Identifying patterns in cross-shopping behavior can help you group and segment stores effectively. Knowing the top competitor brands for visitors can inform merchandising and in-store decisions. Knowing which stores pull in ‘Old Navy customers’ compared to ‘Ralph Lauren customers’ enables you to create tailored marketing campaigns.
The analysis looks at the consumer behavior of visitors, ranking retailers based on the percentage of visitors that have been seen at each. The data is visualized in a table which can be filtered by category and distance to the nearest location.
Note: Visitor Cross-Shopping analytic replaces Visitor Destinations
After a recent review of the Visitor Destinations data, we decided that it did not meet our rigorous quality standards. Visitor Cross-Shopping provides a more accurate insight into shopping patterns.
If you used the Visitor Destinations map to identify the distance that visitors travel to get to your store, the Trade Area Analysis tool has you covered.
Read the Visitor Cross-Shopping guide →
↳ Tenant Finder report tailored to your Center
You can now create a Tenant Finder report directly from the Centers section. The new report will preload the location and automatically exclude current tenants.
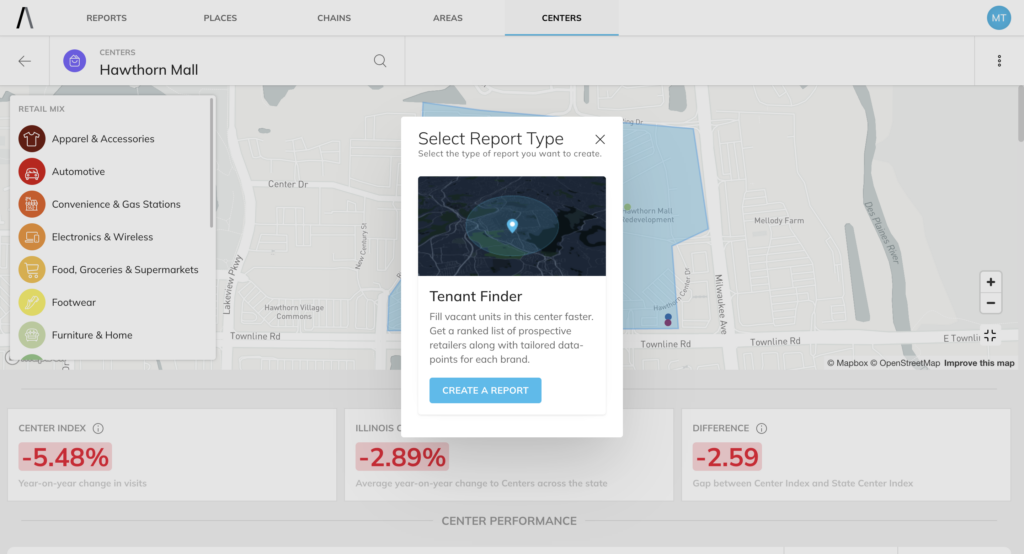
The objective of this new flow is to provide a better user experience by connecting the Centers section directly to the Tenant Finder report.
When users are analyzing their center, they no longer have to leave the page and reselect their location to pull a report. In addition, by using this flow, current tenants will not be recommended.
↳ Bug fixes
An error in the Benchmark Analysis .csv export has been fixed. The issue occurred when a category name had a comma – (e.g. Food, Groceries and Supermarkets).
When such a category was exported as a .csv, the comma was registered as a delimiter. This resulted in a misaligned .csv file.
The issue has now been resolved.
↳ Need additional help?
If you’re looking for additional help, you have a few options:
- Review our Help Center
- Contact customersuccess@passby.com to book a demo
- Contact support@passby.com to raise a support ticket


