

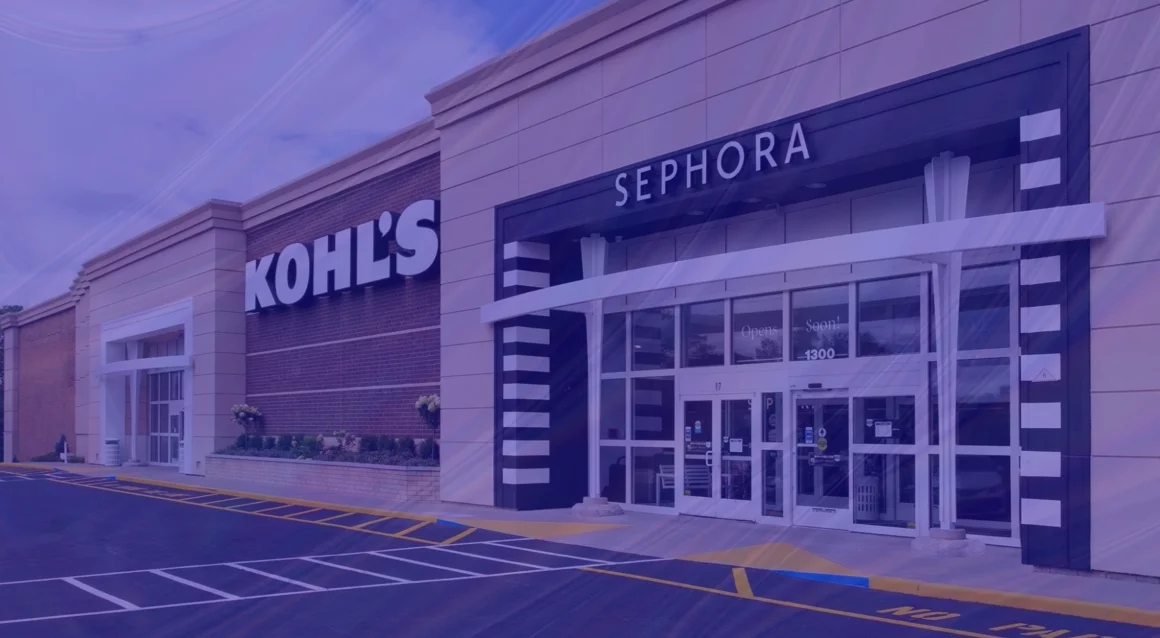
The mainstream narrative on Kohl’s is bleak: a mid-tier department store caught between discount giants and off-price specialists, losing relevance and closing stores. PassBy’s foot traffic data tells a more complicated story. Yes, Kohl’s is under pressure. But it is also quietly outperforming its off-price competitors on traffic growth, delivering a measurable lift through its Sephora partnership, and – most surprisingly – capturing the majority of orphaned visits when its own stores close. This report examines the data behind the Kohl’s turnaround attempt, and what it means for real estate teams, operators, and anyone watching the middle market.
Kohl’s is outgrowing off-price
on foot traffic. Nationally.
The most counter-intuitive finding in this dataset: Kohl’s is growing foot traffic faster than TJ Maxx, Marshalls, and Burlington – the very retailers most often cited as the cause of its decline. Across its total fleet, Kohl’s posted +1.94% YoY traffic growth versus -1.41% for the off-price group – a gap of 3.35 percentage points in Kohl’s favour. That gap holds across every format measured.
+3.35pt gap in Kohl’s favour
+3.34pt gap in Kohl’s favour
+3.37pt gap in Kohl’s favour
For real estate teams: The format-level consistency is striking. Kohl’s outperforms off-price in both standalone and mall environments by almost exactly the same margin. This is not a format-specific story – it is a brand-level momentum shift happening across the entire network. For landlords considering the relative draw of each, Kohl’s is currently the better traffic bet regardless of format type.
A new Sephora lifts Kohl’s traffic
by +7.73% in the following 90 days.
Across 218 Kohl’s locations that received a new Sephora shop-in-shop between 2024 and 2025, PassBy compared foot traffic in the 90 days before opening versus the 90 days after. The result is a clear, measurable signal: Sephora is not just generating beauty revenue – it is driving people into the store who would not otherwise have visited.
Traffic lift in the 90 days after a Sephora opens
Measured across 218 Kohl’s stores that received a new Sephora between 2024 and 2025. Pre-period: 41,924,265 visits. Post-period: 45,163,075 visits.
90-day pre vs. post window
3.2M incremental visits
The 3.2 million incremental visits generated across those 218 stores in a single 90-day window represents a significant and consistent draw. This is not a flagship effect – it holds across Kohl’s typical suburban, standalone format. The implication is that Sephora is functioning as a genuine traffic engine, not merely a revenue line or a PR narrative.
For store operations teams: A +7.73% traffic lift in the 90 days post-Sephora opening has direct implications for staffing, queue management, and in-store capacity. Stores that have recently received a Sephora – or are scheduled to – should be modelling a meaningful increase in total visits, not just beauty category sales. The halo effect extends beyond the beauty section.
For real estate teams: The Sephora traffic signal provides a new variable for site-level underwriting. Locations without Sephora that are in trade areas with strong beauty demand represent latent upside – the question for landlords is whether the Kohl’s lease structure captures any of that incremental visit value. For new site negotiations, the Sephora rollout schedule is worth surfacing explicitly.
When a Kohl’s closes, the traffic
mostly stays with Kohl’s.
When a retailer closes a store, the critical question for the network is: where does the orphaned traffic go? Do shoppers transfer loyalty to the nearest surviving location, or do they defect to competitors? PassBy modelled this using a geospatial blast radius approach – drawing a 10-mile radius around every Kohl’s that permanently closed between 2024 and 2025, then tracking foot traffic at surviving Kohl’s and off-price competitors within that zone in the 90 days after closure.
The finding is one of the strongest pieces of evidence for Kohl’s brand stickiness in this dataset: surviving Kohl’s stores captured a +6.97% traffic lift, while off-price competitors within the same radius saw only +2.93%.
+6.97%
69 stores within 10-mile radius
Traffic lift in the 90 days after a nearby Kohl’s permanently closed. Shoppers transferred to the next closest Kohl’s location at a significantly higher rate than they defected to competitors.
+2.93%
380 stores within 10-mile radius
Traffic lift in the same 90-day window at TJ Maxx, Marshalls, and Burlington locations within 10 miles of the closed Kohl’s. A real but smaller capture – roughly 2.4x less than surviving Kohl’s locations.
The ratio matters here. For every percentage point of closure traffic that flows to off-price competitors, roughly 2.4 percentage points flow to a surviving Kohl’s. Despite the popular narrative that Kohl’s shoppers are defecting en masse to TJX and Burlington, the closure data suggests the opposite: when given the choice between a longer Kohl’s trip and a nearby off-price alternative, most Kohl’s customers choose the longer Kohl’s trip.
For real estate and network planning teams: This finding has direct implications for how Kohl’s should model its store closure programme. Closing an underperforming location does not simply surrender that traffic to the market – a meaningful portion transfers to the nearest surviving Kohl’s. The network optimisation question becomes: is the revenue lift at the surviving store sufficient to offset the lost revenue at the closed one? On traffic terms, the transfer rate appears high enough to make selective consolidation a viable strategy.
Kohl’s is growing in almost every state.
The gap with off-price varies sharply.
The state-level data reveals Kohl’s momentum as near-universal – positive YoY traffic in all but two states (Alaska at -4.79%, Vermont at -0.01%). But the size of its advantage over off-price competitors varies widely. In states like Kansas (+5.82% Kohl’s vs. +1.49% off-price), Iowa (+4.86% vs. +1.11%), and Missouri (+4.13% vs. +2.24%), Kohl’s is significantly outpacing the off-price group. In others like Michigan (+0.39% vs. -3.89%) and New Hampshire (+4.26% vs. -1.97%), the absolute Kohl’s number looks modest but the gap is wide because off-price is declining sharply.
Only Alaska and Vermont see off-price outperform Kohl’s – in Alaska by just 1.01 percentage points, in Vermont by 0.26 points. Everywhere else, Kohl’s leads.
| State | Kohl’s YoY | Off-Price YoY | Gap (Kohl’s advantage) |
|---|---|---|---|
| KS | +5.82% | +1.49% | |
| IA | +4.86% | +1.11% | |
| AR | +4.49% | +0.72% | |
| NH | +4.26% | -1.97% | |
| MO | +4.13% | +2.24% | |
| LA | +3.95% | -1.45% | |
| AL | +3.79% | +0.53% | |
| MT | +3.79% | +0.51% | |
| MD | +3.70% | -0.99% | |
| SC | +3.62% | -1.20% | |
| WA | +3.31% | -0.71% | |
| PA | +3.23% | -0.71% | |
| OK | +3.21% | -0.11% | |
| NE | +3.19% | -2.90% | |
| KY | +3.05% | +0.28% | |
| ME | +2.99% | -2.08% | |
| NM | +2.94% | -1.20% | |
| WV | +2.59% | -0.52% | |
| GA | +2.61% | -1.22% | |
| IL | +2.78% | -0.62% | |
| UT | +2.79% | -0.94% | |
| TN | +2.19% | -1.49% | |
| CO | +2.08% | -1.48% | |
| ID | +2.52% | -0.62% | |
| FL | +0.76% | -2.37% | |
| WI | +1.95% | -0.21% | |
| NY | +1.04% | -1.37% | |
| TX | +1.10% | -2.19% | |
| CA | +1.36% | -1.32% | |
| MI | +0.39% | -3.89% | |
| VT | -0.01% | +0.25% | |
| AK | -4.79% | -3.78% |
The widest gaps are in unexpected places. New Hampshire (-6.23pts in Kohl’s favour), Nebraska (-6.09pts), Mississippi (-6.11pts), and Wyoming (-6.03pts) show some of the largest advantages for Kohl’s – in each case driven by off-price traffic declining sharply in those states while Kohl’s holds positive. These are not high-density retail markets, which suggests Kohl’s benefits from lower off-price competition in smaller-footprint states where TJX and Burlington have fewer locations.
Three data points.
Three decisions to revisit.
Real Estate and Network Planning
Kohl’s is outperforming off-price on traffic nationally, and closure traffic largely stays within the Kohl’s network. Selective consolidation is viable – and in trade areas with Sephora rollout potential, the remaining stores carry meaningful upside. Treat Kohl’s locations differently depending on Sephora status.
Store Operations
The +7.73% 90-day traffic lift from a Sephora opening is an operational event, not just a commercial one. Stores in the Sephora rollout pipeline should be modelling increased visit volumes, adjusting staffing ratios, and reviewing in-store flow ahead of opening – not after.
Marketing and Growth
The state-level data offers a clear prioritisation map. States like KS, IA, AR, and NH where Kohl’s already leads off-price by 4+ percentage points are markets where marketing investment will land on fertile ground. States where the gap is narrowing – or where off-price is still positive – warrant a closer look at competitive positioning.
The data does not support
the obituary being written for Kohl’s.
Foot traffic growth ahead of off-price competitors. A measurable, consistent Sephora halo. Closure traffic that largely stays loyal to the brand. A positive YoY signal in 48 out of 50 states. This is not the picture of a retailer in freefall – it is the picture of a brand under real strategic pressure that is nonetheless holding its customer base more effectively than the conventional wisdom suggests.
The challenges are real: leadership instability, a need to define a clearer identity, and a middle-market position that requires constant justification against both up-market and down-market alternatives. But the foot traffic fundamentals, at this point in time, are stronger than the narrative.
Methodology: All foot traffic data sourced from PassBy Almanac. Fleet performance compares Kohl’s same-store YoY growth against TJ Maxx, Marshalls, and Burlington combined. Sephora analysis compares 90-day pre and post windows across 218 stores receiving a new Sephora between 2024 and 2025. Blast radius analysis draws a 10-mile radius around permanently closed Kohl’s locations and measures traffic at surviving Kohl’s and off-price stores within that zone in the subsequent 90 days.