


When deciding a new retail location or expanding an existing site, an important part of the process is analyzing the current tenants of the market before you continue.
This process can help you begin to analyze if a market is oversaturated, give you an idea of potential competition, and help to point out a gap in the market.
We’ll walk you through how you can examine a tenant mix using AI in under 5 minutes to begin your tenant mix analysis.
Sign up to access PassBy’s AI tools and market intelligence platform.
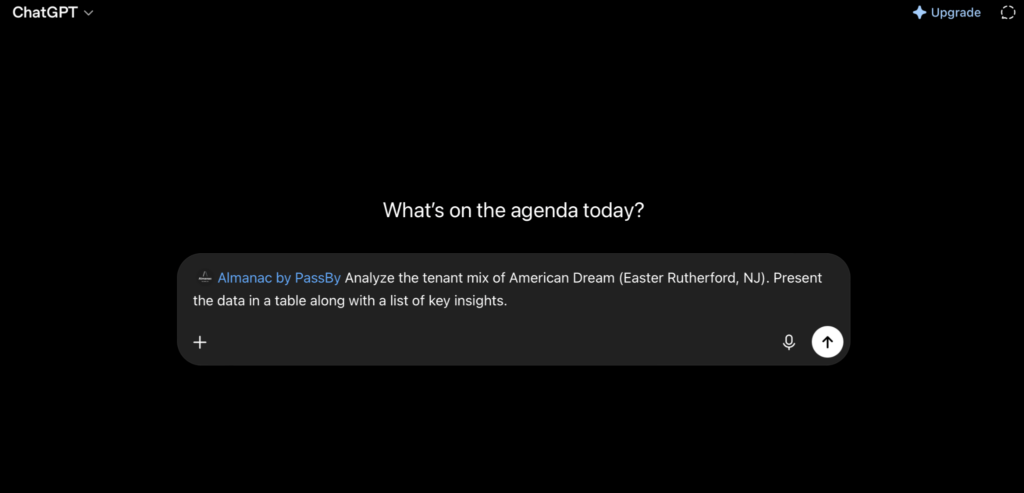
Step 1: Login and enter the prompt
If you haven’t used the Almanac integration before, speak to your account manager or see use the Almanac app in ChatGPTor Co-Pilot to begin.
To analyze a retail market’s saturation levels, you will need to:
- Select the Almanac app on your AI agent
- Enter your question or use our prompt template below
Prompt template:
Analyze the tenant mix of [market]. Present the data in a table along with a list of key insights.
Step 2: Load the analysis
Wait for the AI to load an answer to your question. This should take about a minute.
Your AI may provide a link to the Almanac platform where you can access dashboards, reports and other tools to help you analyze a tenant mix in further detail.
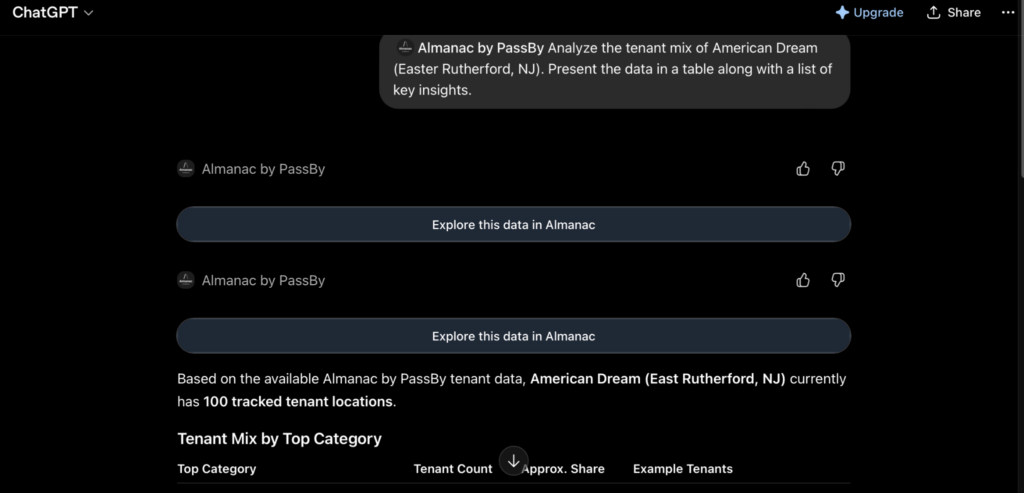
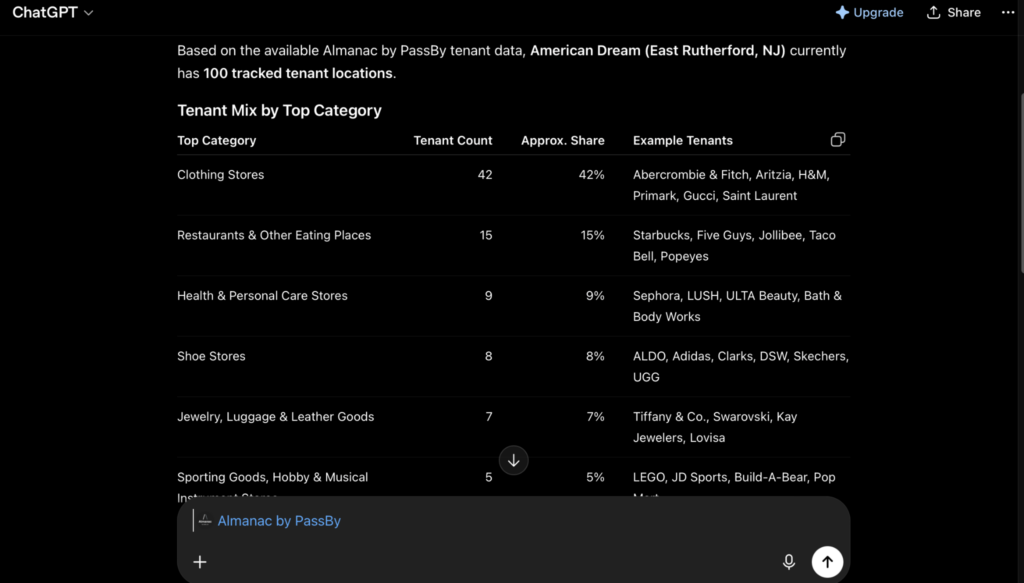
You should then see a table of current tenants within the market and their retail category.
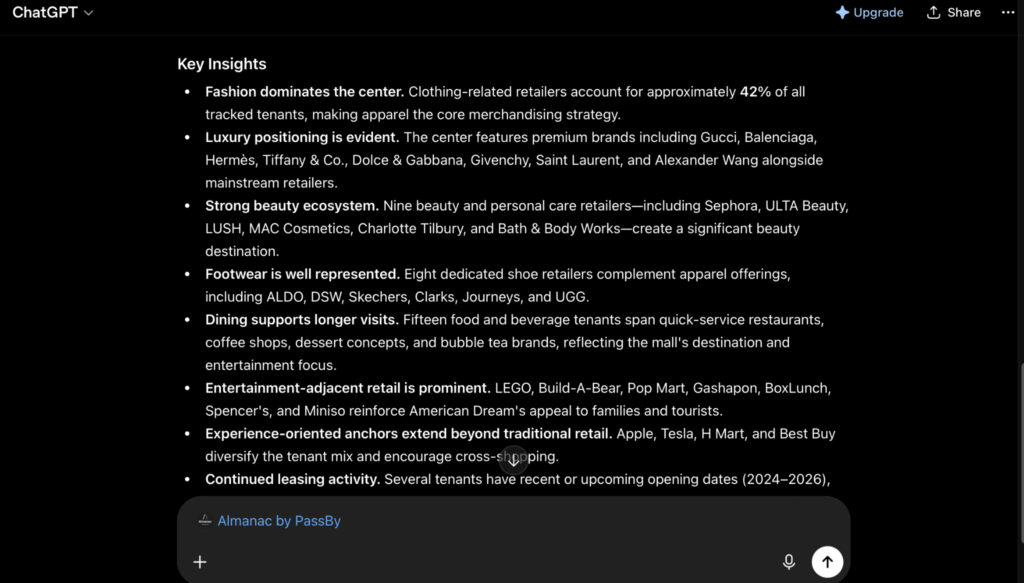
Beneath the table should be a list of key insights. This can provide a quick analysis and overview of the tenant mix.
Step 3: Clarifying questions
The great thing about using an AI tool is that you can ask further questions when you need more data without needing to click around on a platform. It’s fast and easy to navigate.
You can continue the chat of your original query or begin a new conversation. In this example, we’ll continue with the original chat to get some more information about tenant mix.
Questions your AI can help you with:
- What retail category is overrepresented?
- What category is missing or underrepresented?
- What is the ratio of anchors to in-line tenants? Is there a strong anchor store?
- What is the split between retail, food & beverage and services?
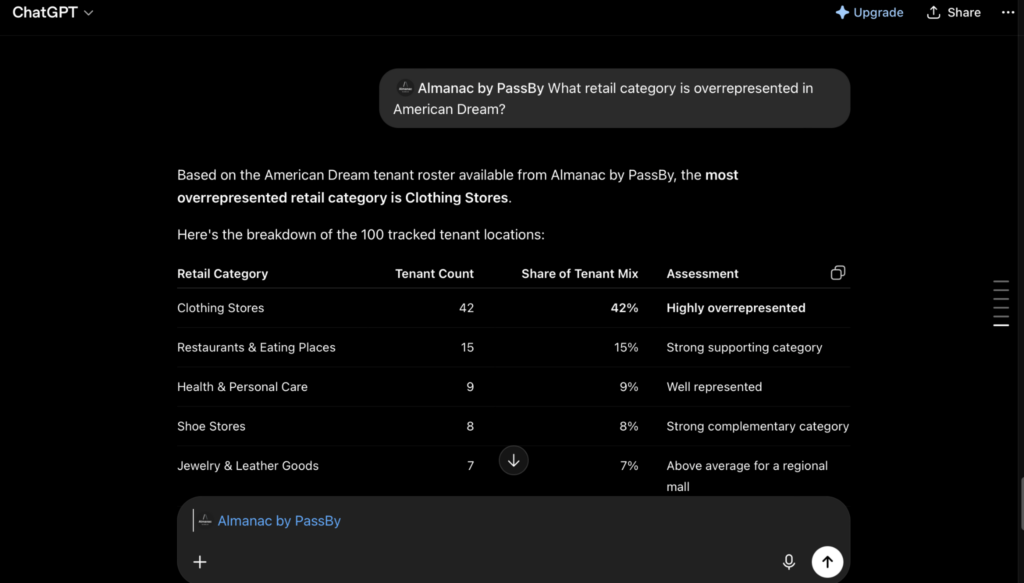
Step 4: Sharing the response
There are a few easy ways to share the data from your AI chat.
- Click the copy button in the top right of any table to paste it into any spreadsheet or document.
- Click the copy button at the bottom left of the response to paste the response into a document.
- Select the Share button in the top right of the chat screen for a shareable link.
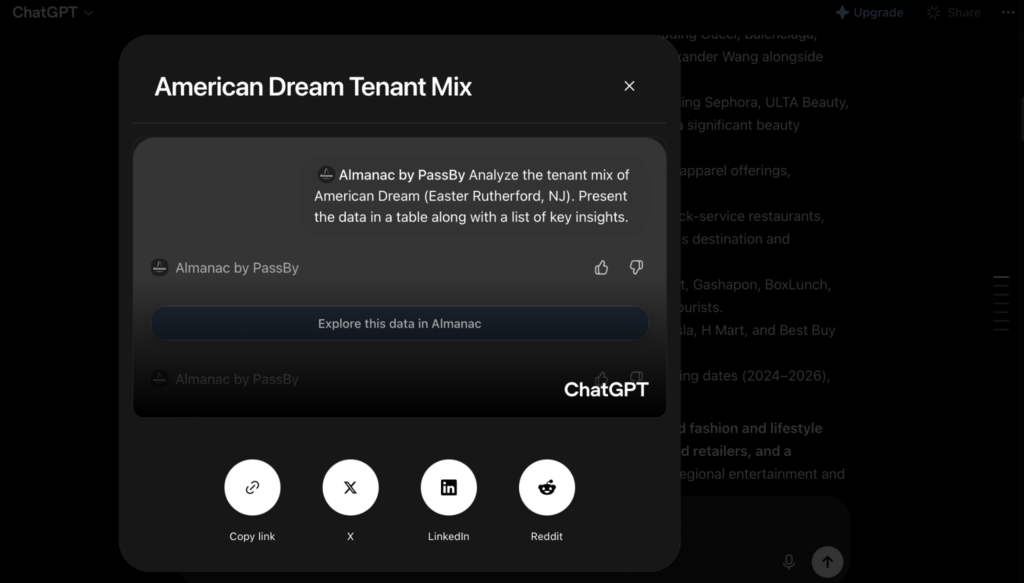
Step 5: Using Almanac for further analysis
PassBy’s AI tools are quick and easy to use, but sometimes you need more than the AI can provide. If you want to:
- Rank retail tenants in a market
- Visualize the foot traffic performance of a market
- Save the tenant mix analysis in a dashboard to return to at a later data
- Download the data as a CSV file
You will need the Almanac platform for these finer details.
Analyze a tenant mix with PassBy
Need to analyze tenant mix? Sign up for an Almanac account today to unlock powerful insights.
If you are already an Almanac user, connect your account to ChatGPT or Co-Pilot to get instant answers to your data questions.
FAQs
Do I need an Almanac account?
Yes, you will need an Almanac account to analyze a tenant mix. You can book a 15 minute walkthrough with our team here to see if Almanac suits your needs.
How is my data used and protected?
We take data sovereignty seriously. Our integration uses a secure API bridge. While we track which data points are accessed (to ensure your account limits and permissions are respected), we do not access your private chats themselves. Your conversation with the AI stays between you and the AI provider.
Can I analyze tenant mix on mobile?
Yes, you can use our AI integrations on mobile devices via the official ChatGPT app on iOS and Android. It’s perfect for getting a quick pulse check while you’re physically visiting a store or a potential new site.