At pass_by, we’re always working to give retailers a clearer view of what’s happening beyond their four walls. Foot traffic has long been our foundation, but traffic alone doesn’t tell the full story.
That’s why we’re excited to launch Spend Insights, a new feature that surfaces real-time sales and transaction data from the market surrounding each store. Whether you’re evaluating store performance, supporting lease decisions, or trying to understand what’s driving demand (or what’s not), Spend Insights gives you the context you’ve been missing.
Spend data is now available directly in both the Dashboards and Places sections of the platform.
Why this matters
Most retail teams are stuck answering performance questions with internal data alone. When sales drop at a store, it’s difficult to know: is the issue inside the store, or is overall demand in that market down?
Spend Insights bridges that gap by showing you what’s happening in the market surrounding each location, based on anonymized, indexed transaction data.
It’s a way to validate your instincts, troubleshoot issues faster, and build stronger reporting with real external benchmarks.
Key use cases
Store inventory planning
Store and ops teams can use market spend data to detect shifts in demand that may not yet be visible in internal POS systems. If local spend is rising and your store sales are flat, it may be time to rethink stocking decisions.
Lease evaluation and site planning
Real estate teams can compare market-level spend trends to in-store performance to help determine whether a store is truly underperforming, or if the market is simply soft. This becomes a powerful input for lease renewal decisions.
Executive-level reporting
Strategy and insights teams can provide leadership with a clearer narrative: “Store X is down 8%, but local apparel spend is down 10% – we’re outperforming the market.” That kind of context is essential when explaining wins or losses at the store level.
How it works
Spend Insights can be accessed in two places:
1. Dashboards
Click “Add Comparison” → “Create New Comparison” → select “Market Spend.”
From there, you can choose between Sales or Transactions, and filter by category (e.g., Total Retail, Apparel, or a more specific vertical). You’ll see new columns appear with current period, previous period, and growth data – side by side with your internal metrics.
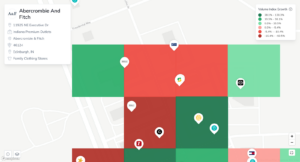
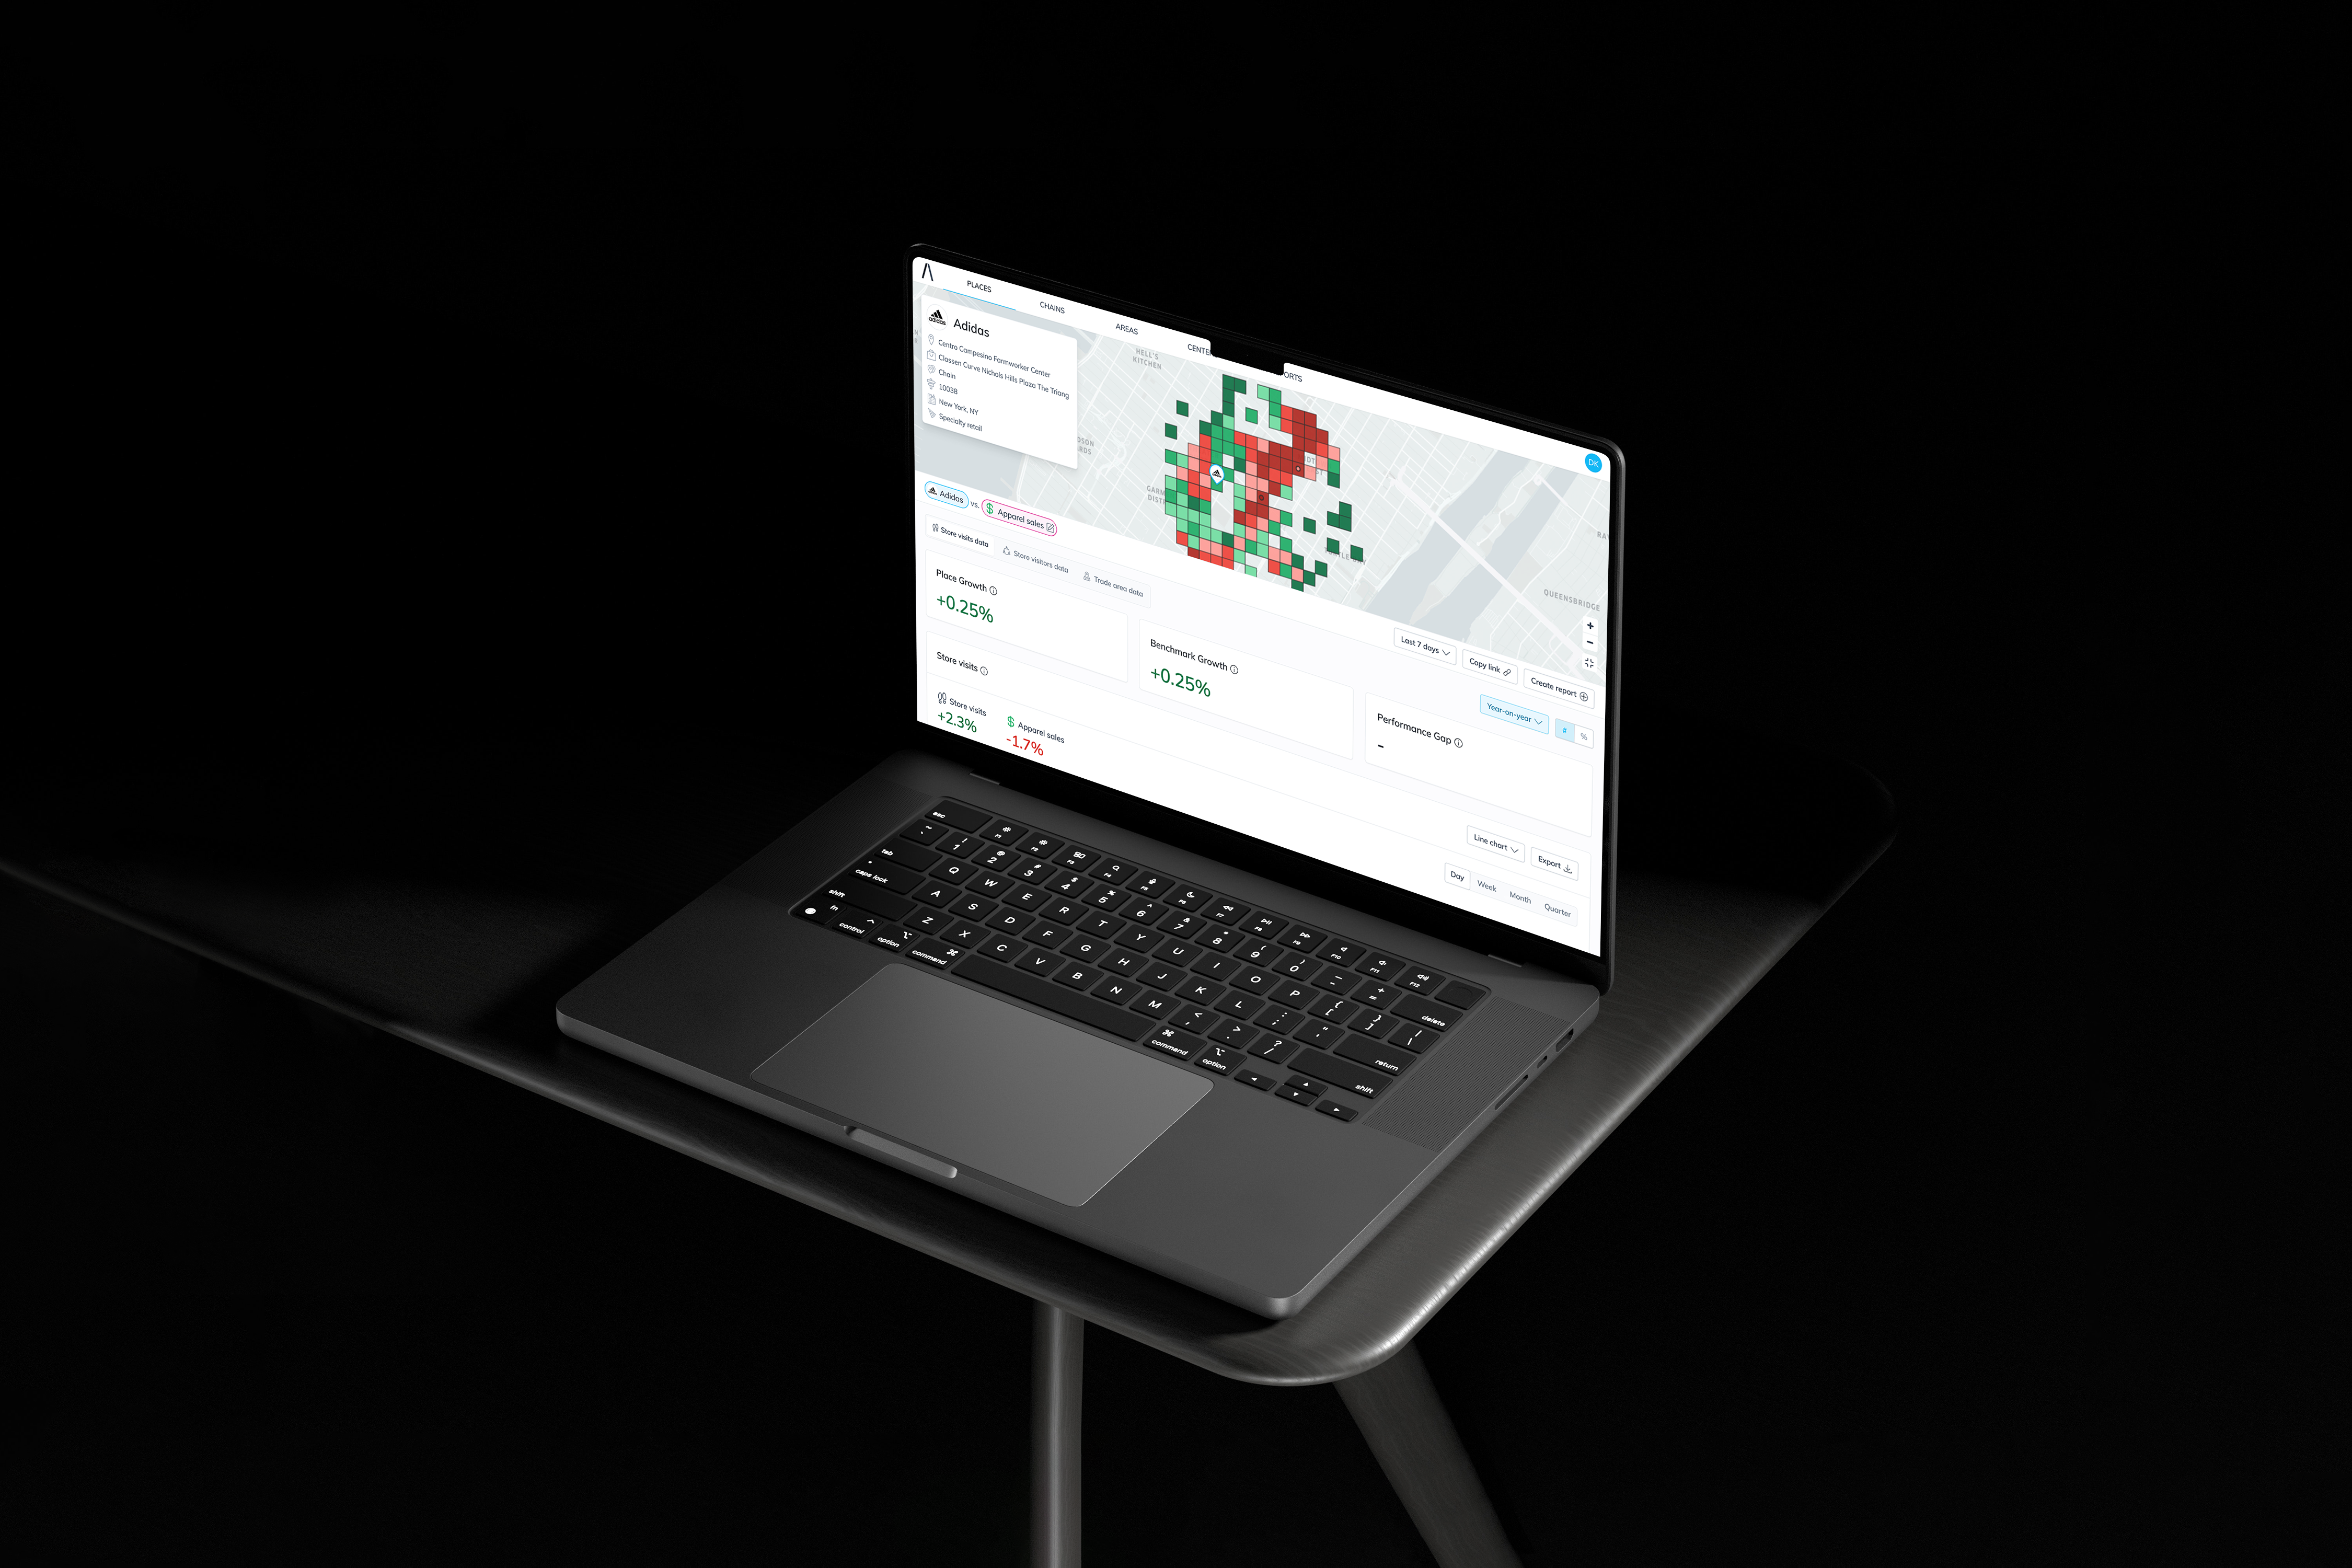
2. Places
Click into any store row in the dashboard to launch Places. You’ll be able to see spend trends mapped across the trade area, switch between absolute values and growth rates, and view time series data over your selected range.
You can export the data at any time, whether you’re working from the dashboard or within Places.
A few things to keep in mind
- Data availability: Spend data updates with a short lag (usually 2–3 weeks). For the best results, avoid selecting time ranges that are too recent.
- Privacy-aware coverage: Not all locations have spend data. If a quad doesn’t meet privacy thresholds (e.g., not enough anonymized volume, or one store dominates the local market), the data may not display.
- Category flexibility: If you don’t see data in your specific vertical, try switching to a broader benchmark like “Total Retail” for directional insights.
What’s next
Spend Insights is just the beginning of a broader push toward surfacing more external market signals across the pass_by platform. Over the coming months, we’ll be expanding category coverage, improving export options, and integrating spend more deeply into additional workflows.
If you’d like a walkthrough or need help interpreting your market data, reach out to your account manager – we’d be happy to help.
We’re excited to see how this new layer of intelligence helps you drive smarter, faster decisions for retailers.