

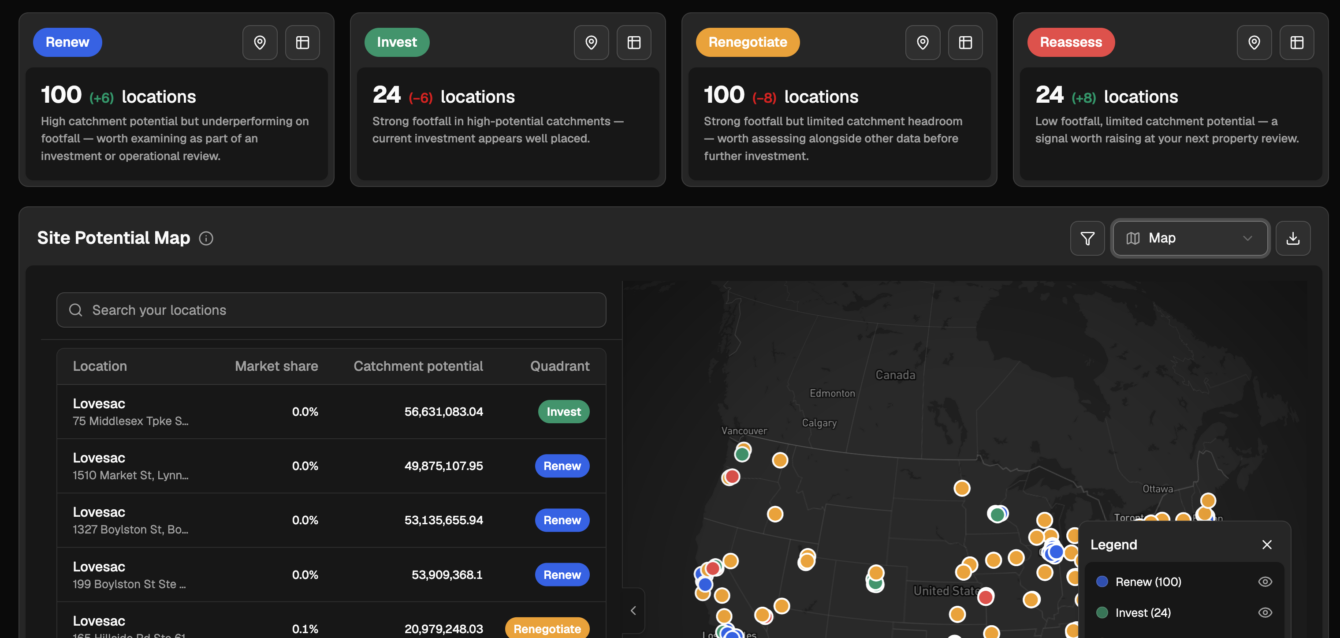
Introducing Your Almanac
Until now, Almanac told you what was happening across the retail market. Powerful, but it stopped at your front door. You still had to connect the dots between what the market was doing and what your stores were doing.
This release closes that gap. Your Almanac brings your own stores and first-party data into the platform, lets you organise and compare them on your terms, and shows you exactly where you stand against the competition.
Same market intelligence. Now anchored to your business.
Six new features make it work – grouped into three simple ideas.
1. Bring your store data into Almanac
The market only means something when it’s measured against your footprint. So the first step is getting your business into Almanac.
✦ Integrate first-party data
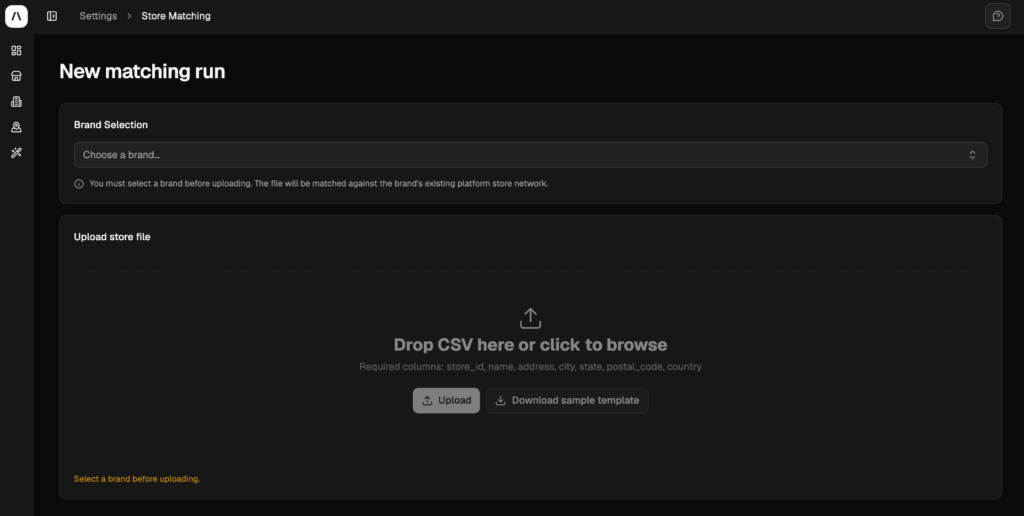
Map your stores to PassBy’s data and see your own numbers alongside ours. Connecting your first-party data doesn’t just put your locations on the map, it improves accuracy, anchoring Almanac’s view to what you actually see on the ground. Your data and the market’s, finally in one place.
✦ Store Groups
Your network isn’t one undifferentiated blob, so your analysis shouldn’t treat it that way. Store Groups let you filter and segment your locations by any number of fields – region, format, performance tier, or your own custom attributes. Slice your estate however your teams actually think about it, and carry those groups through every view.
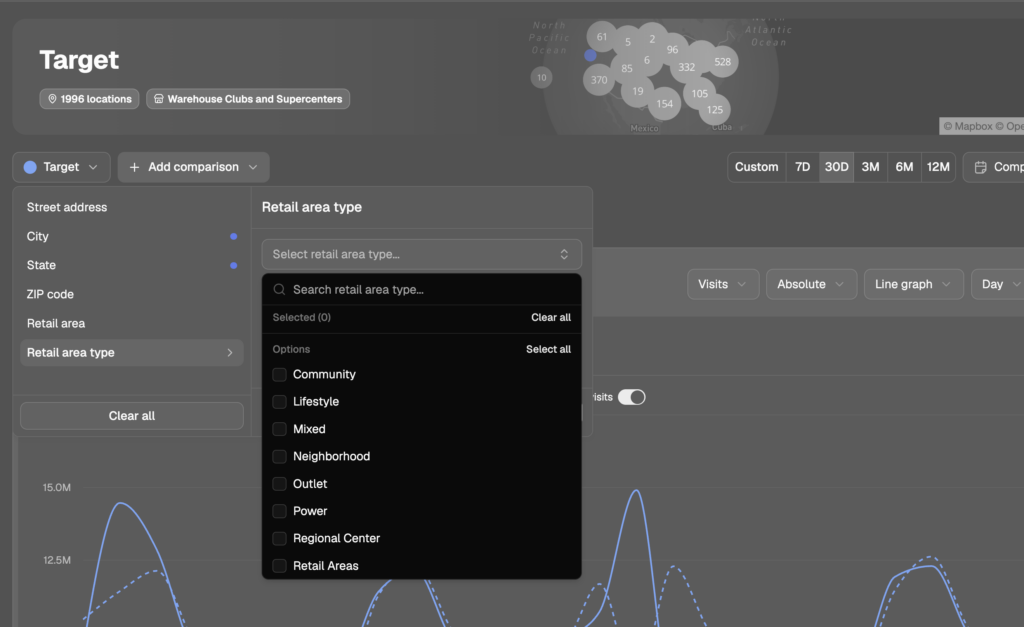
Why it matters: Almanac stops being a generic market tool and becomes a mirror of your specific business – accurate, and organised the way you work.
2. Analyse on your terms
With your world inside Almanac, the next step is making sense of it — quickly, and with control over the questions you ask.
✦ Dashboards
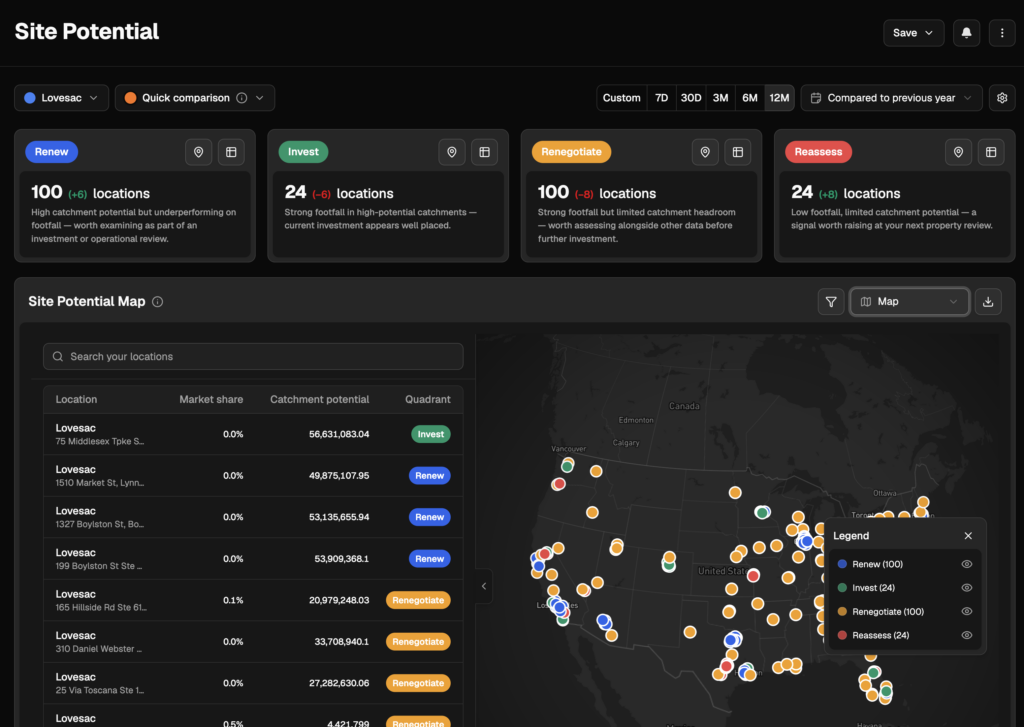
Actionable insights based on the trends across your store network, surfaced automatically. Instead of hunting through data, you open Almanac and immediately see what’s moving, where, and what deserves attention – turning raw signal into a prioritised view of your network’s performance.
✦ Comparisons
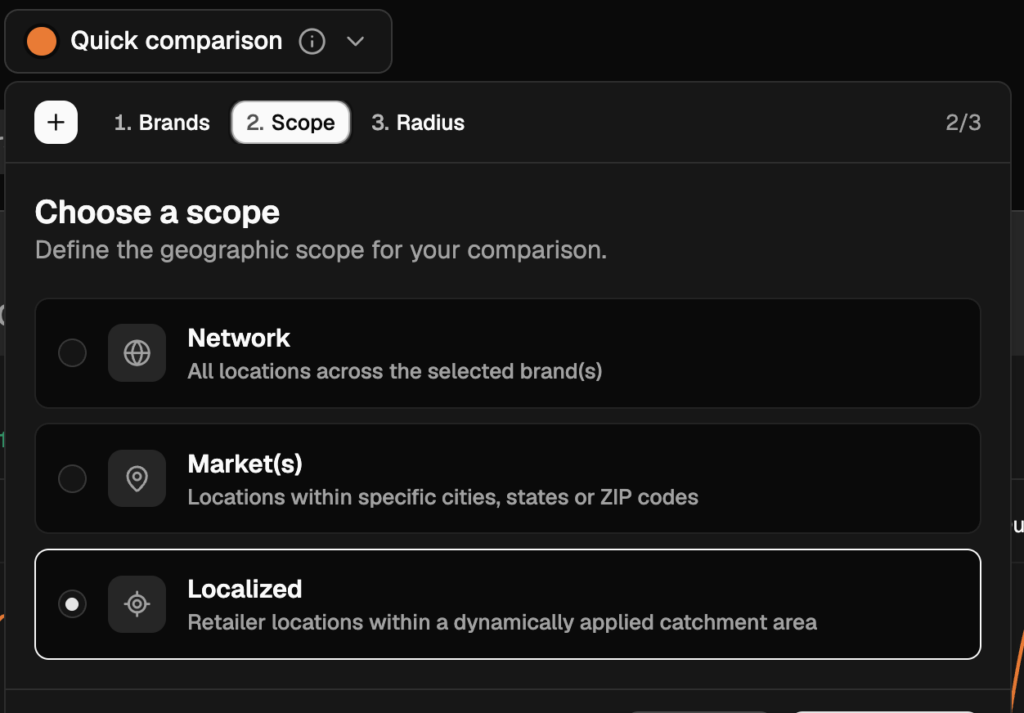
Analysis is only as good as what you compare against. Comparisons give you far greater control over the benchmarks you add – choose exactly which locations, competitors, and markets you measure yourself against, so every comparison is fair, relevant, and yours to define.
Why it matters: You get answers, not just data – and you decide the terms of the comparison, rather than accepting a one-size-fits-all benchmark.
3. See where you really stand
The whole point of market intelligence is knowing your position. These two features show you how customers really see you, and how your share is moving.
✦ Cross-shopping
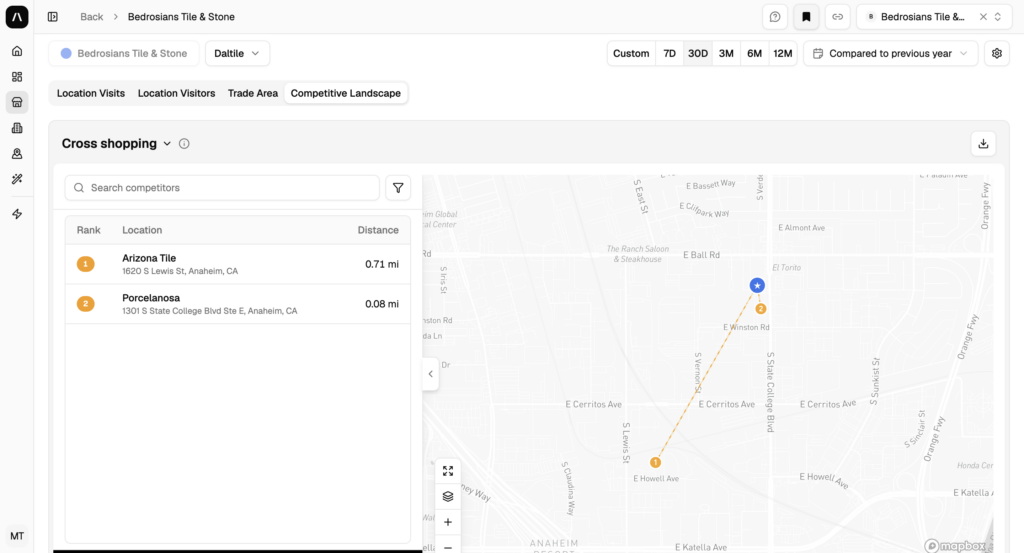
See the locations consumers actually compare you to. Powered by online search data, cross-shopping reveals the real competitive set in each market, often not the competitors you’d assume. Understand who you’re really up against for each customer, store by store.
✦ Market share
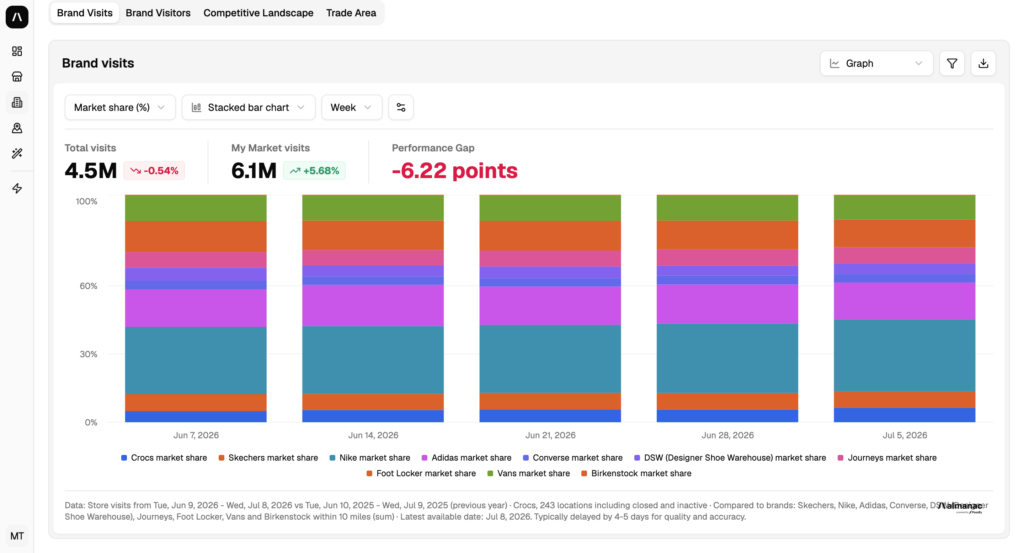
Track market dynamics and watch how your share changes over time. See whether you’re gaining or losing ground in a market, how quickly, and against whom, the difference between reacting to a shift and seeing it coming.
Why it matters: You move from “how are my stores doing?” to “how am I doing versus everyone else competing for the same customer?” – the question that actually drives strategy.
We’ve also made big improvements to visits analysis across a number of views inside Almanac. Watch that here. We will go into more detail on this in the coming weeks.
Access these new feature today inside Almanac. Login here →