


Every retailer expanding their physical footprint faces the same risk: opening a new store that takes customers from an existing one rather than capturing new ones. This is store cannibalisation, and it is one of the most common causes of disappointing new-store economics.
The problem is not that cannibalisation exists. Some degree of overlap between stores is inevitable and sometimes intentional. The problem is when it is undetected, unquantified, or underestimated. A real estate team that opens a new location expecting 5,000 weekly visits but discovers that 2,000 of those visits migrated from a store 10 minutes away has not grown the network by 5,000 visits. It has grown it by 3,000 and weakened an existing location in the process.
Foot traffic data transforms cannibalisation from a risk you discover after the lease is signed into one you quantify before the commitment is made. This guide covers how cannibalisation works, how to measure it, how to predict it for new sites, and how to use the analysis for ongoing portfolio decisions.
What retail store cannibalisation actually is
Store cannibalisation occurs when a new or existing location draws customers away from another location operated by the same brand. The net effect is that total network traffic (and revenue) grows by less than the new store’s standalone performance would suggest, because some of that performance comes at the expense of a sibling store.
It is distinct from product cannibalisation (where a new product reduces sales of an existing product in the same store) and competitive displacement (where a competitor takes your customers). Store cannibalisation is an internal problem: your own locations competing with each other.
This matters for several reasons. The financial model for a new store typically assumes the store’s traffic is incremental to the network. If 30-40% of that traffic is transferred from an existing location, the new store’s return on investment is materially lower than projected. The existing store’s performance declines, potentially triggering a review or closure that would not have been necessary without the new opening. And the operational cost of running two stores serving a partially overlapping customer base is higher than serving the same customers from one optimally placed location.
Why cannibalisation happens
Cannibalisation is not a random outcome. It results from specific, identifiable conditions in the store network.
Proximity without differentiation. Two stores of the same brand within a short drive of each other will inevitably share customers unless they serve demonstrably different functions (a flagship vs an outlet, for example). The closer the stores, the higher the overlap. In urban markets with dense store networks, proximity-driven cannibalisation is the primary risk.
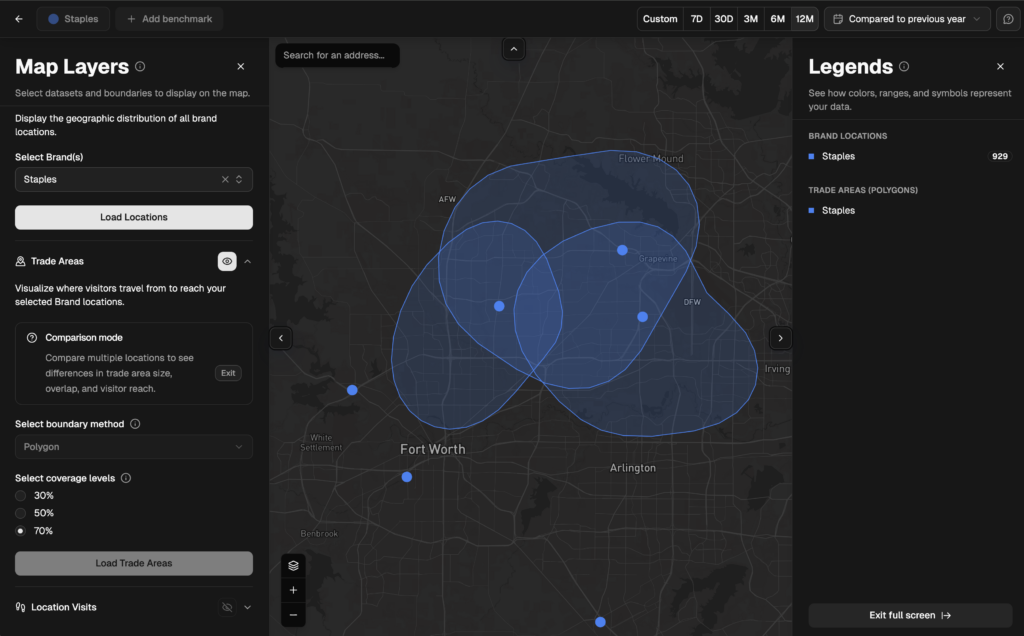
Trade area overlap. Even stores that are geographically separated can cannibalise each other if their trade areas overlap significantly. A store on the east side of a metro and one on the west side might share visitors who work in the centre and could conveniently visit either location. Trade area overlap is not visible from a map. It requires visitor movement data to detect.
Format collision. A brand that operates both full-price and outlet formats in the same metro risks cannibalisation between them if the customer base overlaps. Consumers who discover they can buy the same brand at outlet prices may reduce their visits to the full-price store. This is particularly relevant for apparel brands, where PassBy’s data shows significant traffic divergence between formats.
Channel collision. While this article focuses on store-to-store cannibalisation, the same principle applies between physical and digital channels. A retailer offering the same product cheaper online with free delivery may cannibalise its own stores. BOPIS (buy online, pick up in store) can work in the opposite direction, driving incremental store visits, but the net effect depends on the category and execution.
Aggressive expansion without data. The most common cause of cannibalisation is simply opening stores faster than the analysis supports. Under pressure to hit store-count targets, real estate teams may accept locations with known overlap risk because the standalone projections look attractive. The standalone projections are not wrong. They are incomplete.
How to measure cannibalisation
Trade area overlap analysis
The foundational measurement is trade area overlap: what percentage of one store’s visitors also visit (or could visit) another store in the network.
PassBy’s trade area analysis shows, for any pair of locations, the observed catchment boundaries built from actual visitor movement data. When two stores’ trade areas overlap, the percentage of overlap quantifies the cannibalisation risk directly.
A concrete example: Store A draws visitors from a trade area extending 12 minutes north, 15 minutes south, and 10 minutes east. A proposed Store B, located 8 minutes southeast of Store A, has a projected trade area that overlaps with Store A by 35%. This means approximately 35% of Store B’s expected visitors already have convenient access to Store A. Those visitors are not incremental to the network. They are redistributed from it.
In Almanac, you can evaluate trade area overlap for any pair of existing or proposed locations. For a step-by-step guide, visit the help centre.
The cannibalisation rate formula
The standard formula for measuring cannibalisation after a new store has opened is:
Cannibalisation rate = (decline in existing store traffic after new store opens) / (new store traffic) x 100
If Store A was receiving 8,000 weekly visits before Store B opened, and now receives 6,500 while Store B receives 5,000, the cannibalisation rate is:
(8,000 – 6,500) / 5,000 x 100 = 30%
This means 30% of Store B’s traffic came from Store A. The network gained a net 3,500 incremental visits (5,000 new minus 1,500 transferred), not 5,000.
The formula requires before-and-after foot traffic data for the existing store, controlled for seasonality and market-wide trends. If overall traffic in the market declined 5% during the same period, you need to adjust the baseline to avoid attributing a market-wide decline to cannibalisation.
Net incremental analysis
The more complete measurement looks at the entire network, not just the pair of stores closest to the new location. A new store might cannibalise not just its nearest sibling but two or three stores in a metro if the trade areas overlap with multiple locations.
Net incremental visits = new store visits – sum of (traffic decline at all affected existing stores, adjusted for market trends)
This is the number that belongs in the financial model. It is the true measure of what the new store added to the network.
How to predict cannibalisation before opening
Measuring cannibalisation after the fact is useful for understanding your network, but the highest-value application is predicting it before committing to a new location.
Pre-opening trade area modelling
Before a store opens, PassBy’s data lets you model its likely trade area based on the characteristics of the location, the competitive landscape, and the observed trade areas of comparable stores.
The process works as follows: identify the proposed site, define its projected trade area using comparable store data and demographic analysis, then overlay that projected trade area against the observed trade areas of your existing stores. The percentage of overlap becomes the predicted cannibalisation rate.
This is not a guess. It is built on the same visitor movement data that defines your existing stores’ trade areas. The prediction is as good as the data underlying it, and PassBy’s data covers 1.5 million US locations with 5+ years of history.
Scenario modelling
The most effective way to use cannibalisation analysis is to run multiple scenarios:
Scenario A: Open the proposed site. Projected traffic: 5,000/week. Projected cannibalisation: 30% from Store A. Net incremental: 3,500/week.
Scenario B: Open an alternative site 3 miles further from Store A. Projected traffic: 4,200/week. Projected cannibalisation: 12% from Store A. Net incremental: 3,696/week.
Scenario B generates fewer standalone visits but more incremental visits because the cannibalisation risk is lower. The alternative site adds more value to the network despite looking weaker on paper.
This kind of analysis prevents the “best standalone site” fallacy, where teams choose the highest-traffic site without accounting for network effects. The best site for the network is not always the best site in isolation.
Setting cannibalisation thresholds
Most retailers establish an acceptable cannibalisation threshold that new locations must meet. Common thresholds range from 15% to 30%, depending on the category, brand strategy, and growth stage.
A brand in aggressive expansion mode might accept up to 30% cannibalisation if the new store captures significant competitor traffic alongside the internal overlap. A mature brand optimising its network might set a stricter 15% threshold to protect per-store economics.
The threshold should be calibrated to your specific business: what cannibalisation rate still results in positive ROI for the new store given your rent, operating costs, and revenue per visit?
Cannibalisation in portfolio management
The same analysis that predicts cannibalisation for new stores applies to ongoing portfolio decisions.
Identifying existing cannibalisation
Many retailers have stores in their current network that are cannibalising each other, often the result of acquisitions, legacy expansion decisions, or market changes that shifted trade area boundaries over time.
PassBy’s trade area overlap analysis across your entire portfolio reveals which pairs of stores share the most visitors. Stores with greater than 40% overlap are candidates for consolidation or differentiation.
Closure analysis
When considering closing an underperforming store, the critical question is: where will its traffic go? If 70% of the closing store’s visitors have another of your locations within their trade area, the closure preserves most of your network traffic. Those visitors simply shift to the nearest sibling store.
If only 30% of visitors have an alternative location and 70% would need to switch to a competitor, the closure costs you customers permanently. Foot traffic trade area data models this redistribution before you make the decision.
Expansion sequencing
For brands planning multiple store openings, the order matters. Opening Store B before Store C might create less total cannibalisation than opening them in reverse order, because each store’s trade area influence changes the network geometry.
Modelling the cumulative cannibalisation impact across a multi-store expansion plan, rather than evaluating each store independently, produces a more accurate projection of network growth.
Category-specific considerations
Cannibalization risk varies by retail category because trade area size and visit frequency differ.
QSR and convenience. Trade areas are small (often under 5 minutes drive) and visit frequency is high. Cannibalisation risk is high in dense urban networks but can be acceptable because the sheer frequency of visits means even a cannibalised store may generate enough traffic to be profitable. Many QSR brands deliberately accept cannibalisation to maximise market coverage and prevent competitor entry.
Apparel and fashion. Trade areas are larger (15-20 minutes) and visit frequency is lower. Cannibalisation is more damaging because each lost visit has higher value. DTC apparel brands expanding from 30 to 100 stores face the highest cannibalisation risk because their customer base was acquired digitally and may be concentrated differently than expected. PassBy’s apparel data showing brands like Coach growing 20.14% same-store traffic suggests these brands have managed cannibalisation effectively during expansion.
Grocery. Trade areas are moderate (8-12 minutes) and visits are frequent. Grocery cannibalisation is most commonly triggered by adding a smaller-format store near an existing full-size location, or by the presence of grocery-anchored competitors that effectively split the catchment.
Department stores and malls. Cannibalisation often occurs at the mall level rather than the brand level. A new mall opening near an existing one redistributes the entire tenant base’s traffic, not just a single brand’s. PassBy’s mall data showing super-regional centres declining 1.2% YoY may partly reflect cannibalisation from newer mixed-use and lifestyle developments.
For category-specific site selection guidance, see apparel site selection and the general retail site selection guide.
Getting started
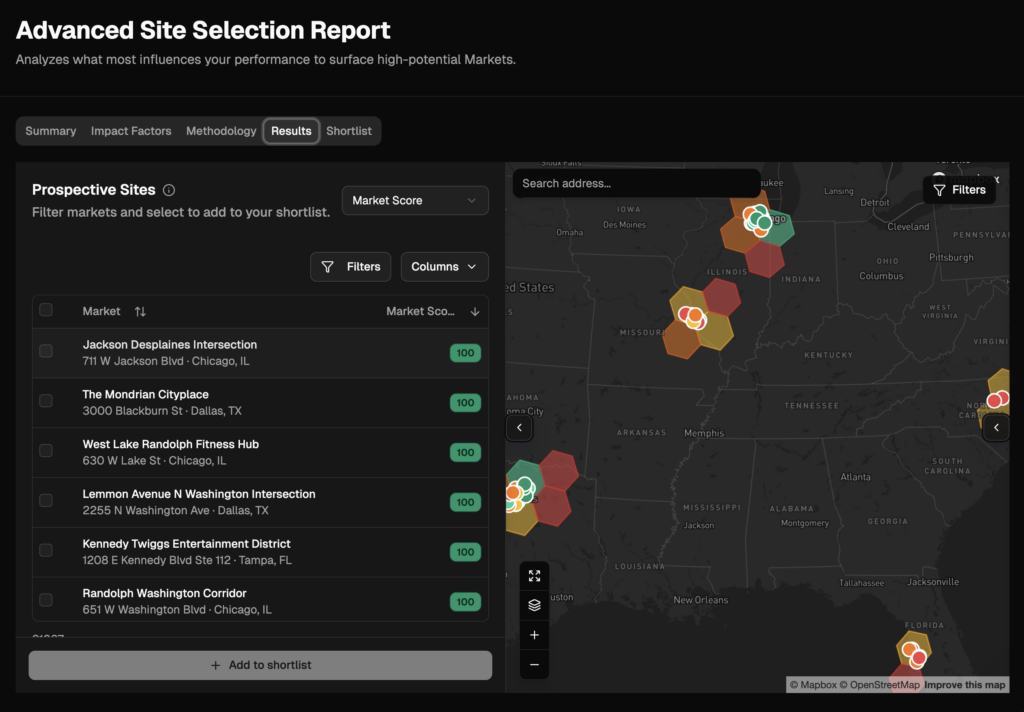
PassBy’s Almanac platform provides trade area overlap analysis, competitive benchmarking, and visitor movement data for any pair of existing or proposed locations across 1.5 million US stores. Real estate teams can evaluate cannibalisation risk as part of the standard site evaluation workflow.
For teams evaluating PassBy for the first time, the Test & Learn tier provides 90 days of Almanac access. Enough time to analyse your existing network for cannibalisation, evaluate pipeline sites, and build the internal case for data-driven expansion planning. See pricing →
For a walkthrough of trade area overlap analysis in Almanac, visit the help centre or book a demo →.
FAQ
What is retail cannibalisation? Retail cannibalisation occurs when a new store draws customers away from an existing store operated by the same brand, reducing the net traffic gain from the new opening. It is measured as the percentage of new store traffic that is transferred from existing locations rather than being incremental to the network.
How do you calculate a cannibalisation rate? Cannibalisation rate = (decline in existing store traffic after new store opens) / (new store traffic) x 100. For example, if an existing store loses 1,500 weekly visits after a new store opens and the new store receives 5,000 weekly visits, the cannibalisation rate is 30%. The calculation should be adjusted for seasonality and market-wide trends.
What is an acceptable cannibalisation rate? Most retailers set thresholds between 15% and 30%, depending on category and strategy. QSR brands often accept higher rates (25-30%) because high visit frequency means cannibalised stores can remain profitable. Apparel and specialty retailers typically target lower rates (15-20%) because each lost visit has higher value. The right threshold is the rate at which the new store still delivers positive ROI after accounting for the impact on existing locations.
How do you predict cannibalisation before opening a new store? Trade area overlap analysis compares the projected trade area of a proposed new location against the observed trade areas of existing stores. The percentage of overlap predicts the cannibalisation rate. PassBy’s data builds trade areas from actual visitor movement data rather than theoretical drive-time radii, making the prediction more accurate.
Can cannibalisation be good? Sometimes, yes. A brand may intentionally accept cannibalisation to increase market coverage and prevent competitor entry. If a proposed new store would cannibalise 25% of an existing store’s traffic but also capture 40% of a competitor’s traffic, the net competitive effect is positive. The analysis should consider both internal cannibalisation and competitive displacement.
How does cannibalisation analysis help with store closures? When considering closing an underperforming store, trade area data predicts where its visitors would go. If most visitors have another of your locations within their trade area, the closure preserves network traffic. If most would go to a competitor, the closure costs you customers permanently. This redistribution analysis is the data-driven alternative to closing the lowest-revenue store and hoping for the best.