

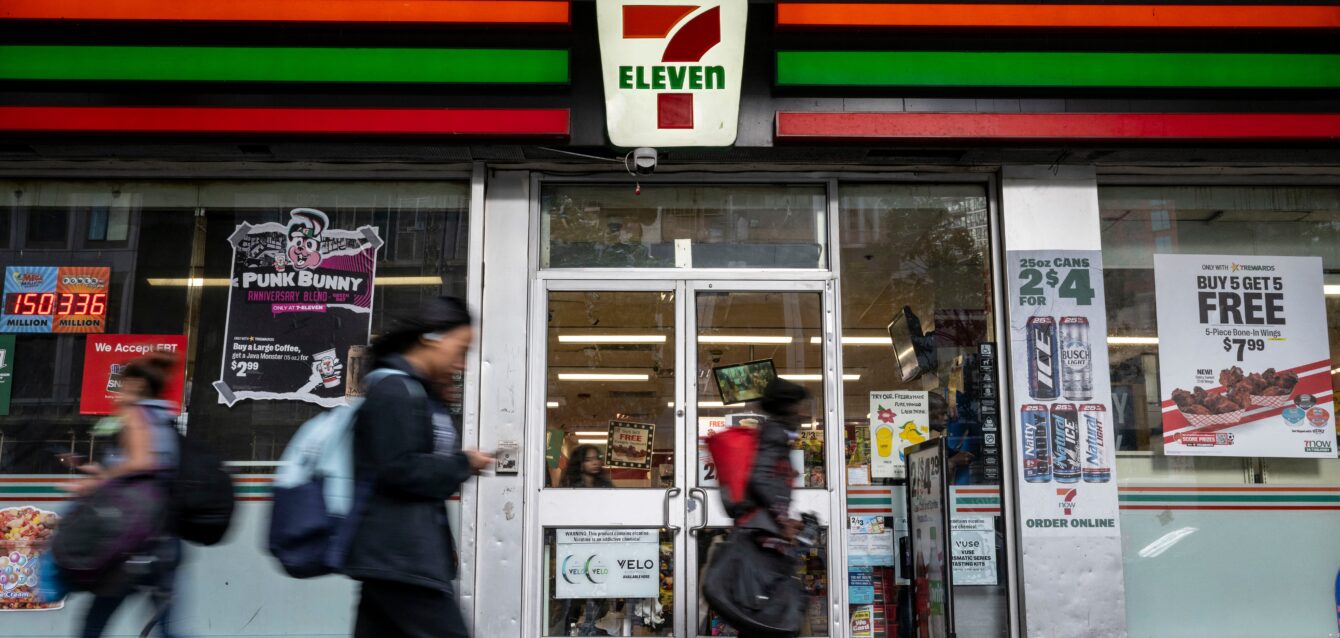
7-Eleven is closing 645 stores across North America this fiscal year. It is the fifth consecutive year the chain has closed more locations than it has opened. The parent company, Seven & i Holdings, frames this as a strategic pivot toward larger, food-forward formats.
But the question nobody has answered with data: is this a 7-Eleven problem, or a convenience store problem?
We pulled foot traffic data across 10 convenience store and fuel retail chains — covering more than 24,500 locations — to find out. The answer is more nuanced than the headlines suggest. The sector is not dying. It is splitting in two.
The full picture: 10 chains ranked by foot traffic growth
We compared average per-store visits from January through May 2026 against the same period in 2025. The results separate the industry into clear tiers.
Only two of the ten chains we tracked are growing per-store visits year-over-year. Both are regional, food-led operations. Every national, gas-station-first chain is declining.
The full data
| # | Brand | Stores | Avg Visits/Store (2025) | Avg Visits/Store (2026) | YoY Change |
|---|---|---|---|---|---|
| 1 | Sheetz | 827 | 70,231 | 71,917 | +2.4% |
| 2 | Kwik Trip | 912 | 15,390 | 15,686 | +1.9% |
| 3 | QuikTrip | 1,212 | 59,334 | 59,196 | -0.2% |
| 4 | Buc-ee’s | 51 | 62,577 | 61,866 | -1.1% |
| 5 | Royal Farms | 322 | 18,998 | 18,779 | -1.2% |
| 6 | RaceTrac | 617 | 59,901 | 58,461 | -2.4% |
| 7 | Wawa | 1,212 | 16,676 | 15,954 | -4.3% |
| 8 | 7-Eleven | 9,718 | 9,254 | 8,805 | -4.9% |
| 9 | Circle K | 6,554 | 15,103 | 14,310 | -5.3% |
| 10 | Speedway | 3,022 | 58,230 | 55,049 | -5.5% |
Data: PassBy. Jan–May 2026 vs Jan–May 2025. Per-store visits use same-store methodology — only locations active in both periods are compared.
7-Eleven: the data behind the 645 closures
7-Eleven’s per-store traffic has been declining consistently. From January through May 2026, the average 7-Eleven location received approximately 8,805 monthly visits — down 4.9% from 9,254 in the same period last year.
To put that in context: 7-Eleven’s per-store traffic is the lowest of any chain in this analysis. A typical Sheetz location draws 8x more visits. A QuikTrip draws nearly 7x more. Even Kwik Trip, with roughly a tenth of 7-Eleven’s footprint, generates almost twice the per-store visits.
The 645-closure plan is not aggressive enough if traffic continues declining at this rate. 7-Eleven is not just losing visits in aggregate — it is losing them per store, which means the problem is demand, not portfolio size. Closing underperformers helps margins, but the remaining 9,000+ locations still face the same headwind.
Seven & i Holdings says the closures will fund 205 new, larger-format locations focused on fresh food and improved customer experience. The data from competitors suggests this is the right strategic direction — but the execution timeline matters. Every month of delay is another month of 5% traffic decline at existing stores.
Speedway and Circle K: the other national chains in trouble
7-Eleven is not alone. The two other national-scale convenience chains in our dataset are declining faster.
Speedway (3,022 stores) is the worst performer at -5.5% per-store traffic YoY. Owned by the same Seven & i Holdings that owns 7-Eleven, Speedway’s decline is accelerating: it posted -7.0% in March and -8.0% in May. The chain has been in strategic limbo since the 2021 acquisition from Marathon Petroleum, and the traffic data suggests the integration has not delivered.
Circle K (6,554 stores) is down -5.3%. Parent company Alimentation Couche-Tard is the world’s largest convenience store operator, but scale is not translating into traffic growth in the US market. Circle K’s decline mirrors the broader pattern: large, gas-station-anchored formats are losing ground.
The Wawa surprise
Wawa is widely considered one of the best-run convenience chains in America. Its food quality, store experience, and cult-like customer loyalty set it apart from the pack. But the traffic data tells a different story: Wawa is down -4.3% per-store YoY.
There are likely two factors at play. First, Wawa has been expanding aggressively — adding nearly 100 stores in the past year (from 1,127 to 1,212). New stores take time to reach maturity, and per-store averages get diluted during rapid expansion. Second, Wawa’s Mid-Atlantic and Southeast markets are highly competitive, with Sheetz, Royal Farms, and RaceTrac all competing for the same “food-forward convenience” customer.
The Wawa decline may be a growth investment rather than a structural problem. But it is worth watching — if per-store traffic does not stabilise as new stores mature, the expansion economics get harder to justify.
Why Sheetz and Kwik Trip are winning
The only two chains growing per-store traffic share a common DNA: they compete on food, not fuel.
Sheetz: +2.4% YoY (827 stores)
Sheetz has invested heavily in its made-to-order food programme, expanded its menu to include breakfast, lunch, and dinner options, and positioned itself as a restaurant that happens to sell fuel. The stores are larger than average, clean, and designed for longer dwell times. The result: Sheetz generates 71,917 average monthly visits per store — the highest per-store traffic of any chain in this analysis.
Sheetz is also expanding, adding stores from 732 to 827 over the past two years, but unlike Wawa, it is managing to grow per-store traffic while expanding the footprint. That is rare.
Kwik Trip: +1.9% YoY (912 stores)
Kwik Trip is the Midwest’s answer to Sheetz — an employee-owned chain that consistently ranks among the top convenience stores for customer satisfaction. Like Sheetz, it emphasises fresh food (its bakeries produce in-store daily) and a clean, welcoming store environment. The chain is growing visits at +1.9% while the rest of the industry contracts.
What the data reveals: two industries diverging
The convenience store sector is not declining uniformly. It is bifurcating into two distinct business models with opposite trajectories.
| Model | Characteristics | Traffic Trend | Examples |
|---|---|---|---|
| Food-forward regional | Larger stores, made-to-order food, destination visits, food-as-anchor | Growing +1.9% to +2.4% | Sheetz, Kwik Trip |
| Gas-station-first national | Smaller stores, packaged goods, fuel-anchored, convenience-as-afterthought | Declining -4.3% to -5.5% | 7-Eleven, Circle K, Speedway |
The middle tier — QuikTrip (-0.2%), Buc-ee’s (-1.1%), Royal Farms (-1.2%) — shares characteristics with both models. QuikTrip and Buc-ee’s have strong food programmes and high per-store traffic but are showing early signs of softening. These chains may be leading indicators of where the food-forward model hits its ceiling, or they may be experiencing temporary macro pressure that does not reflect structural decline.
What this means for retailers and real estate teams
For convenience store operators, the data is clear: the gas-station-first model is losing relevance. Consumers increasingly treat convenience stores as food destinations, and the chains that have invested in that shift are the only ones growing. 7-Eleven’s pivot to larger, food-focused formats is the right strategy — the question is whether it can execute fast enough to outrun the -4.9% annual traffic decline at existing stores.
For commercial real estate professionals, the 645 7-Eleven closures plus ongoing Speedway and Circle K portfolio rationalisation will create significant void opportunities. The most attractive vacancies will be in markets where a food-forward operator does not yet have presence. Understanding trade area dynamics and visitor profiles at these soon-to-close locations will help identify which sites have transferable demand.
For investors, the sector divergence creates a clear framework: long the food-forward operators investing in store experience, short the gas-station-first nationals that have not adapted. Foot traffic data provides the leading indicator — traffic declines precede same-store sales declines by one to two quarters, giving an early read on which operators are gaining or losing ground.
Methodology
This analysis uses PassBy’s foot traffic dataset, derived from mobile device signals calibrated against in-store hardware sensors at 94% correlation. Per-store visits represent average monthly visits per active location for the January–May period in both 2025 and 2026. Only locations active in both periods are included to ensure a same-store comparison. Store counts reflect the number of active locations in the most recent month of data.
PassBy tracks foot traffic for over 2 million retail locations. Learn more about our data methodology →