


Most retail real estate teams spend the majority of their time evaluating new locations. The portfolio they already have receives less analytical attention, even though the existing network represents the largest asset on the balance sheet and the greatest source of both risk and opportunity.
Portfolio optimization is the discipline of continuously evaluating whether every store in your network is in the right location, in the right format, serving the right trade area, and delivering an acceptable return. It is the complement to expansion strategy: while expansion adds stores, portfolio optimization ensures the stores you already have are performing as well as they can.
The retailers that manage their portfolios with data make better decisions on every dimension: which stores to invest in, which to close, which to relocate, and which to convert to a different format. The retailers that do not end up discovering underperformance too late, closing stores reactively rather than strategically, and carrying locations that drag down network economics for years.
Why portfolio optimization matters now
Several forces are making portfolio optimization more urgent than it has been in the past decade.
Lease cycles are turning over. Stores opened or renewed during the post-pandemic recovery period (2021-2023) are approaching their first renewal windows. Each renewal is a decision point: does this location still justify its cost given how the trade area has changed?
Consumer geography is shifting. Remote and hybrid work have permanently altered commuter patterns in many markets. A store that thrived on weekday office traffic may now underperform three days a week. Residential patterns are shifting too, with population moving from dense urban cores to suburbs and secondary cities in many metros.
Format expectations are evolving. What a store needs to be in 2026 — a brand experience center, a fulfillment node, a community hub — differs from what it needed to be in 2019. Some existing locations support the new requirements. Others are structurally limited by their size, configuration, or lease terms.
Competitive dynamics change continuously. A store that was the only option in its trade area five years ago may now face two new competitors. Conversely, a store in a market where a competitor recently closed may have an expanded opportunity it is not currently capturing.
Foot traffic data provides the ongoing measurement system that makes portfolio optimization possible. Without it, portfolio reviews rely on sales data alone, which is a lagging indicator that does not distinguish between store-level execution problems and market-level structural changes.
The portfolio optimization framework
Step 1: Benchmark every store against its market
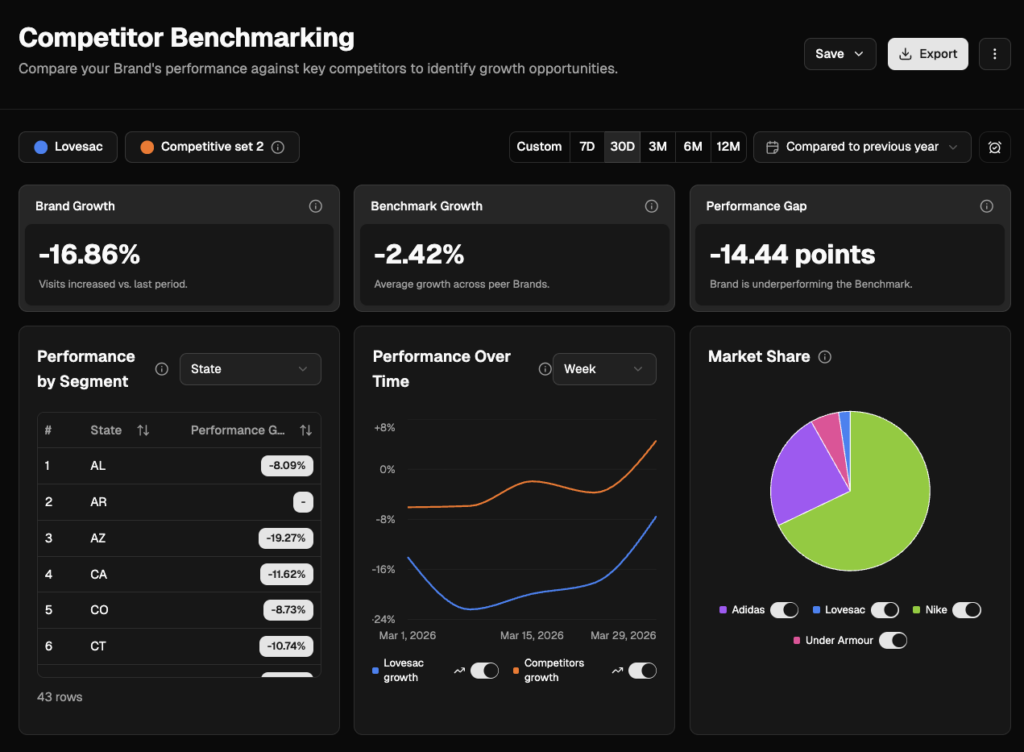
The foundational analysis is not “how is each store performing?” but “how is each store performing relative to its local market?”
A store with flat same-store traffic might look fine in isolation. But if competitors in the same trade area are growing 5%, the store is losing share despite stable numbers. Conversely, a store with declining traffic might be outperforming a market where traffic is declining even faster.
PassBy’s competitive benchmarking in Almanac compares each of your stores against relevant competitors in the same trade area. This contextual view separates execution issues (the store is underperforming its market) from market issues (the market itself is weakening). The diagnosis determines the response:
Store underperforming its market → execution problem. Investigate staffing, merchandising, marketing, store condition. The market opportunity exists; the store is not capturing it.
Store performing in line with a declining market → market problem. The store is executing well but the location’s potential is shrinking. Consider relocation or closure at the next lease event.
Store outperforming its market → investment opportunity. This location has proven it can win. Consider expanding the format, increasing marketing investment, or using it as a model for new sites in similar markets.
For a walkthrough of competitive benchmarking in Almanac, visit the help center.
Step 2: Identify the stores that need action
With every store benchmarked against its market, segment the portfolio into action categories.
Protect and invest. Stores that outperform their market and operate in trade areas with stable or growing demographics. These are your best assets. Protect them with lease renewals on favorable terms and invest in store experience, marketing, and staffing.
Monitor. Stores performing in line with their market in stable trade areas. No immediate action needed, but watch for early signs of market deterioration or competitive entry that could shift them into a lower tier.
Diagnose and fix. Stores underperforming their market in trade areas that still have strong fundamentals. The opportunity exists — the store needs operational intervention. This might mean a refresh, a management change, adjusted hours, or a localized marketing campaign.
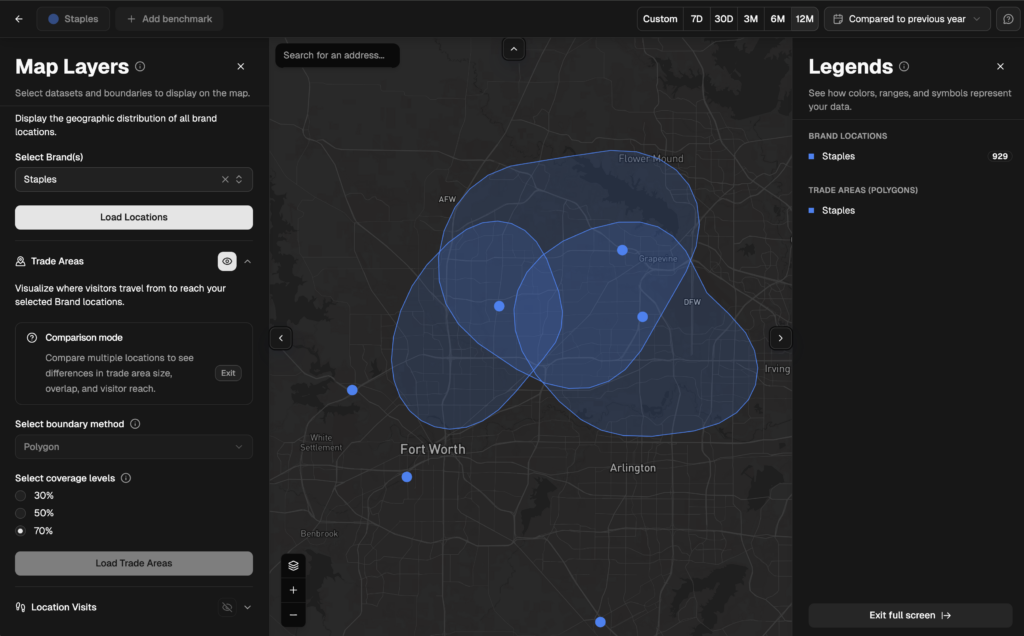
Evaluate for relocation. Stores where the trade area is weakening but a better location exists within the same market. Relocation preserves your market presence while moving to a site with stronger fundamentals. Trade area analysis identifies whether suitable alternative locations exist before the current lease expires.
Evaluate for closure. Stores where both the store and the market are underperforming, the trade area is declining, and no viable relocation exists. Before closing, run the redistribution analysis: where will this store’s customers go? See the closure analysis section below.
Step 3: Run the closure analysis
Closing a store is one of the highest-stakes decisions in portfolio management. Foot traffic data de-risks it by answering the question that matters most: what happens to the customers?
Redistribution modeling. PassBy’s trade area data shows where each store’s visitors come from. When a store closes, those visitors need to find an alternative. If 65% of the closing store’s visitors have another of your locations within their trade area, the network retains most of its traffic. Those visitors shift to the nearest sibling store, which may see a traffic and revenue lift.
If only 25% have an alternative and 75% would need to go to a competitor, the closure permanently surrenders customers. That is a fundamentally different decision with different financial implications.
Net financial impact. The closure analysis should project: rent saved from the closing store, minus revenue lost from customers who switch to competitors, plus revenue gained at sibling stores that absorb redirected traffic. If the net financial impact is positive, the closure strengthens the network. If negative, the store may be worth keeping despite its underperformance, or the timing should wait until a nearby relocation creates a viable alternative.
Lease timing. The optimal time to close is at lease expiration, avoiding early termination penalties. Portfolio optimization should identify closure candidates 12-18 months before their lease events so the decision can be made proactively rather than at the last minute.
Step 4: Evaluate relocations
A relocation preserves your presence in a market while upgrading the specific location. This makes sense when the market is healthy but the current site has structural problems: declining center traffic, poor visibility, a co-tenancy mix that has deteriorated, or a format that no longer fits.
Relocation criteria. The new site should address the specific weakness of the current site while maintaining or improving on its strengths. If the current store’s problem is declining center traffic, the relocation target should be a center with growing traffic. If the problem is poor demographic alignment due to trade area shifts, the relocation target should be closer to where the customer base has moved.
Trade area continuity. The relocation should serve as much of the existing trade area as possible to retain current customers while expanding into new parts of the market. PassBy’s trade area analysis shows how much overlap the proposed new location has with the existing store’s catchment, ensuring the relocation does not inadvertently abandon a portion of your customer base.
Step 5: Optimize format
Some stores underperform not because of their location but because of their format. A full-size store in a market that only supports small format carries unnecessary cost. A small-format store in a market that could support a full-size location leaves revenue on the table.
Format right-sizing. Compare each store’s traffic and revenue against the investment required for its format. If a store generates small-format-level traffic but occupies (and pays for) a full-size space, downsizing at the next lease event reduces cost without proportionally reducing revenue.
Format upgrading. Conversely, if a store consistently operates at capacity with customers unable to access the full product range, the format is constraining performance. Foot traffic data that shows a store’s traffic exceeding its operational capacity signals an upgrade opportunity.
Building a portfolio review cadence
Portfolio optimization is most effective as a recurring discipline, not a one-time project. A structured cadence ensures that every store receives regular evaluation and that action decisions are made proactively.
Quarterly: metric review. Review same-store traffic trends, competitive benchmarking, and trade area health for every location. Flag stores where performance or market conditions have changed materially since the prior review.
Annually: full portfolio assessment. Segment the entire portfolio into the action categories (protect, monitor, diagnose, relocate, close). Align the assessment with lease expiration timelines so that action decisions are made while options remain open.
At lease events: decision point. Every lease renewal is a portfolio optimization decision. Before renewing, evaluate whether the location still meets your criteria given current trade area conditions, competitive landscape, and format requirements. Renewing by default is not optimization.
At competitor events: reactive assessment. When a competitor opens or closes in one of your trade areas, evaluate the impact on your store within 30 days. A competitor closure creates a traffic capture opportunity that may justify increased marketing or extended hours. A competitor opening creates a traffic risk that may require a response.
The metrics that matter
Same-store traffic YoY (market-adjusted). Your store’s traffic change minus the market’s traffic change. A store down 3% in a market down 5% is outperforming by 2 points. A store up 2% in a market up 7% is underperforming by 5.
Traffic share. Your store’s visits as a percentage of total category visits in the trade area. Share gains mean you are winning locally regardless of what the market is doing. Share losses mean the opposite.
Trade area health score. A composite of demographic trends (population, income), foot traffic trends (growing or declining), competitive density (stable, increasing, decreasing), and infrastructure changes (new development or closures). This score predicts whether the market around a store is getting better or worse.
Revenue per visit. Dividing revenue by foot traffic gives you conversion efficiency: how effectively the store turns visitors into buyers. A store with high traffic but low revenue per visit has a conversion problem. One with lower traffic but high revenue per visit is executing well and may benefit from marketing investment to drive more visitors.
Lease cost per visit. Dividing annual rent by annual visits gives you the effective cost of each visitor. This metric makes rent comparisons meaningful across locations with different traffic levels. A store paying $200,000/year rent with 200,000 annual visits costs $1.00 per visit. One paying $300,000 with 500,000 visits costs $0.60. The second is cheaper per opportunity despite the higher absolute rent.
Getting started
PassBy’s Almanac platform provides the ongoing measurement that portfolio optimization requires: competitive benchmarking for every store, trade area health monitoring, traffic trend analysis, and the data for closure redistribution modeling. The Markets view contextualizes each store’s performance within its local market.
For teams running their first portfolio review, the Test & Learn tier provides 90 days of Almanac access — enough to benchmark every store, identify the action categories, and build the case for ongoing monitoring. See pricing →
FAQ
What is retail portfolio optimization? Retail portfolio optimization is the ongoing process of evaluating whether every store in your network is in the right location, in the right format, and delivering an acceptable return. It includes benchmarking stores against their local markets, identifying underperformers, analyzing closure and relocation options, and right-sizing formats to match market opportunity.
How often should retailers review their store portfolio? Quarterly metric reviews (traffic trends, competitive benchmarking), annual full portfolio assessments (segmentation into action categories), and event-driven assessments when competitors open or close nearby. Every lease renewal should trigger a formal evaluation of whether the location still meets criteria.
How do you decide which stores to close? Close stores where both the store and the market are underperforming and no viable relocation exists. Before closing, run redistribution analysis: if most of the store’s customers have another of your locations within their trade area, the closure preserves network traffic. If most would go to competitors, the closure costs you customers permanently. The net financial impact (rent saved minus lost revenue plus transferred revenue) should be positive.
What’s the difference between a store problem and a market problem? A store problem is when the location underperforms relative to competitors in the same trade area — the opportunity exists but the store is not capturing it. A market problem is when the entire trade area is declining and all retailers are affected. The distinction matters because the response is different: store problems require operational fixes, market problems require strategic decisions (relocation, closure, or acceptance).
What metrics should retailers track for portfolio health? Same-store traffic YoY (market-adjusted), traffic share within the trade area, trade area health score (demographic and traffic trends), revenue per visit (conversion efficiency), and lease cost per visit (cost per opportunity). Together these metrics provide a comprehensive view of whether each store is performing, improving, or deteriorating relative to its market.