

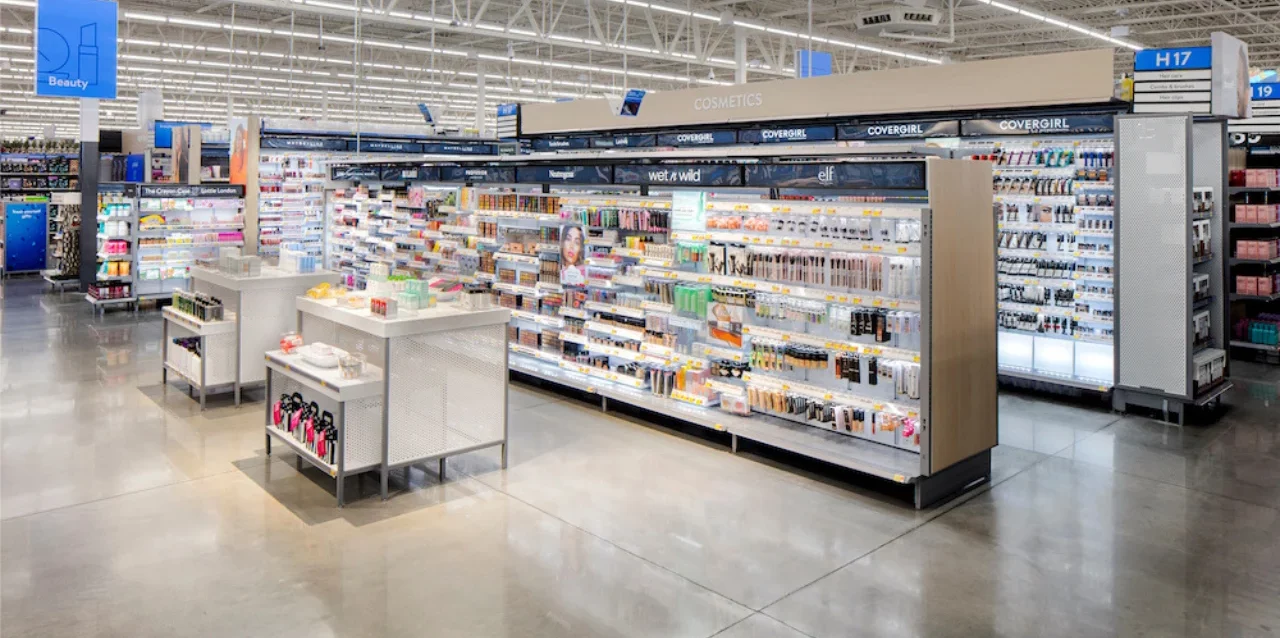
Walmart is hiring 400 beauty associates. Target is replacing its Ulta partnership with in-house “Target Beauty Studios.” Sephora has planted itself inside nearly 1,000 Kohl’s locations. The beauty category has become the most contested battleground in retail — and everyone from mass merchants to specialty chains is fighting for the same shopper.
But who is actually winning the foot traffic war? We analysed same-store visit data across six major beauty retailers to find out what the earnings calls aren’t telling you.
The 12-Month Picture: Beauty Retail Is Growing Everywhere
When you zoom out to a full trailing 12 months (May 2025 – April 2026), the beauty category looks healthy across the board. Every major retailer with beauty exposure is seeing year-over-year foot traffic growth:
| Retailer | Type | 12-Month YoY |
|---|---|---|
| ULTA Beauty | Specialist | +4.1% |
| Target | Mass | +3.8% |
| Sephora | Specialist | +2.9% |
| Bath & Body Works | Specialist | +2.8% |
| Walmart | Mass | +1.8% |
This is not an industry in decline. ULTA Beauty — the chain most often described as “under threat” from mass retail expansion into beauty — is actually leading the category in foot traffic growth over the past year.
But the 12-month view masks a much more volatile story underneath.
The Monthly Trend: A Category That Shifts Fast
When you break the same data into month-by-month year-over-year comparisons, the picture changes dramatically. Beauty retail foot traffic is far more volatile than the annual average suggests:
| Month | Walmart | Target | ULTA | Sephora | Bath & Body Works |
|---|---|---|---|---|---|
| May 2025 | +3.0% | +7.3% | +10.3% | +10.7% | +3.9% |
| Jun 2025 | -0.7% | +6.5% | +7.2% | -0.3% | +2.8% |
| Jul 2025 | +2.9% | +6.6% | +9.7% | +8.8% | +9.6% |
| Aug 2025 | +8.5% | +9.9% | +8.1% | +7.6% | +7.9% |
| Sep 2025 | +5.0% | +8.5% | +6.6% | +14.3% | +4.6% |
| Oct 2025 | +3.7% | +6.6% | +5.2% | +12.1% | +5.0% |
| Nov 2025 | -1.0% | +5.0% | +1.8% | +2.0% | +1.5% |
| Dec 2025 | -5.2% | -2.3% | -2.5% | -15.0% | -4.7% |
| Jan 2026 | +4.3% | +0.2% | +3.5% | +5.7% | +4.6% |
| Feb 2026 | +5.7% | +1.0% | -0.7% | +3.2% | +2.8% |
| Mar 2026 | -1.6% | -3.3% | +0.3% | +0.2% | -1.1% |
| Apr 2026 | -0.4% | +0.5% | +2.8% | +1.5% | +3.3% |
Three things stand out:
1. The December Cliff
December 2025 was brutal for beauty retail. Every single chain saw year-over-year declines. Sephora was hit hardest at -15.0%, followed by Walmart (-5.2%) and Bath & Body Works (-4.7%). This suggests the 2025 holiday season pulled beauty gifting purchases earlier (Black Friday, Cyber Monday) or pushed them online — either way, physical store visits cratered during what should be the biggest month of the year.
2. Sephora’s Rollercoaster
Sephora is the most volatile brand in the set. It surged to +14.3% in September 2025, crashed to -15.0% in December, rebounded to +5.7% in January, and has settled around +1-2% in recent months. This level of volatility makes quarterly comparisons unreliable — a single month can swing the narrative from “Sephora is winning” to “Sephora is in freefall.”
3. The April Recovery
The most recent month of data (April 2026) shows beauty specialists bouncing back: ULTA at +2.8%, Bath & Body Works at +3.3%, Sephora at +1.5%. Meanwhile Walmart has turned negative (-0.4%). The narrative that mass retailers are stealing beauty traffic from specialists doesn’t hold up in the latest data.
How the Time Window Changes the Story
One of the biggest mistakes in retail analysis is cherry-picking a time window that tells the story you want to tell. Here’s how the same brands look across four different comparison windows:
| Retailer | Apr 2026 Only | Q1 FY26 (Feb–Apr) | 6 Months (Nov–Apr) | 12 Months (May–Apr) |
|---|---|---|---|---|
| Bath & Body Works | +3.3% | +1.6% | +0.2% | +2.8% |
| ULTA Beauty | +2.8% | +0.8% | +0.6% | +4.1% |
| Sephora | +1.5% | +1.5% | -2.3% | +2.9% |
| Target | +0.5% | -0.7% | +0.2% | +3.8% |
| Walmart | -0.4% | +0.9% | -0.2% | +1.8% |
Notice how the rankings shift completely depending on your comparison window:
- Pick April only and beauty specialists are crushing mass retail
- Pick the 6-month window and Sephora looks like it’s collapsing at -2.3%
- Pick 12 months and ULTA leads the entire category at +4.1%
This is exactly why defensible foot traffic analysis requires transparency about methodology. The time window, the same-store matching criteria, and the data source all shape the conclusion.
The Shop-in-Shop Report Card
Both Sephora and ULTA have bet heavily on shop-in-shop partnerships with mass retailers. How are those performing compared to their standalone locations?
ULTA at Target: 609 Stores
| Segment | Stores | Q1 YoY | Avg Q1 Visits |
|---|---|---|---|
| Target with Ulta | 609 | -1.5% | 290,446 |
| Target without Ulta | 1,371 | -1.0% | 264,939 |
Targets with Ulta shop-in-shops draw higher absolute traffic (290k vs 265k average quarterly visits), but they are declining faster than Targets without Ulta. And the Ulta mini-stores inside Target are struggling even more: Ulta locations inside Target saw -3.6% YoY traffic, compared to -2.1% for standalone Ulta stores.
With the Ulta-Target partnership expiring in August 2026, this data raises a pointed question: was the partnership driving incremental traffic, or was it simply co-locating with already-stronger Target stores?
Sephora at Kohl’s: 987 Stores
| Segment | Stores | Q1 YoY | Avg Q1 Visits |
|---|---|---|---|
| Sephora at Kohl’s | 987 | -2.9% | 22,561 |
| Sephora standalone/mall | 597 | -3.4% | 34,852 |
Sephora at Kohl’s is outperforming standalone Sephora on a YoY basis (-2.9% vs -3.4%), though standalone locations still draw significantly higher absolute traffic (35k vs 23k quarterly visits). The Kohl’s partnership appears to be providing a more resilient floor for Sephora’s traffic.
Where the Battle Is Hottest: City-Level Data
National averages hide the fact that beauty retail performance varies enormously by market. Here are the top metro areas where mass and specialty beauty traffic is diverging most:
| City | Walmart | Target | ULTA | Sephora |
|---|---|---|---|---|
| Orlando, FL | +4.2% | -0.2% | -1.3% | -0.1% |
| Jacksonville, FL | +3.6% | -2.8% | -3.7% | -4.6% |
| Phoenix, AZ | +1.4% | -0.6% | -3.5% | -6.5% |
| Dallas, TX | -1.2% | -0.9% | -2.6% | -11.7% |
| Los Angeles, CA | -1.7% | -2.9% | -2.9% | -15.9% |
Sephora’s underperformance in major metros is stark: -15.9% in Los Angeles, -11.7% in Dallas. These are not small markets — they are the cities where Sephora has the densest footprint.
Florida is the outlier: Walmart is surging in Orlando (+4.2%) and Jacksonville (+3.6%), suggesting that Walmart’s beauty-focused investments may be landing hardest in Sun Belt markets where the chain has both scale and customer loyalty.
The “Beauty Shift” Markets
We identified eight states where Walmart foot traffic is growing while both ULTA and Sephora are declining year-over-year — markets where mass retail appears to be actively taking beauty traffic from specialists:
| State | Walmart | ULTA | Sephora |
|---|---|---|---|
| New Jersey | +5.8% | -0.1% | -7.1% |
| Vermont | +3.7% | -1.7% | -10.9% |
| Hawaii | +2.5% | -2.5% | -5.0% |
| Wyoming | +1.7% | -3.1% | -3.7% |
| Arkansas | +1.4% | -1.1% | -1.3% |
| California | +1.1% | -0.5% | -5.0% |
| Idaho | +1.1% | -2.3% | -3.7% |
| Nevada | +0.7% | -3.4% | -3.2% |
California and New Jersey stand out as the highest-stakes markets: large populations, dense store networks, and clear traffic divergence between mass and specialist beauty retail.
What This Means
The beauty retail foot traffic story is more nuanced than the headlines suggest. Three takeaways:
- Beauty specialist retail is not dying. Over 12 months, ULTA leads the entire category in foot traffic growth at +4.1%. The “mass retailers are killing specialty beauty” narrative is premature.
- Time window selection matters enormously. You can make any brand look like a winner or loser by picking the right three-month window. Transparent methodology — same-store matching, clearly defined periods, and multiple time horizons — is the only way to produce defensible analysis.
- The shop-in-shop model is under pressure. Both Ulta-at-Target and Sephora-at-Kohl’s locations are underperforming their standalone counterparts. As Target replaces Ulta with its own beauty concept, the question is whether that partnership was ever driving incremental traffic — or just riding the coattails of already-strong locations.
Methodology: This analysis uses PassBy same-store foot traffic data across locations active in both the current and prior-year comparison periods. Visit estimates are derived from mobile device signals normalised against ground-truth benchmarks. All year-over-year comparisons use matching calendar periods to control for seasonality.
Want to see beauty foot traffic data for your markets? Talk to PassBy to access store-level visit data for any beauty retailer in the U.S.