


Apparel brands have always watched their competitors. What is new is the ability to measure them. Before foot traffic data, competitive intelligence in fashion meant walking competitor stores, reading earnings calls, and interpreting product assortment changes. All of that is still useful. But it is qualitative, delayed, and limited to competitors you can physically visit.
Foot traffic data adds a quantitative layer that changes what is possible. You can see how many people visit a competitor’s stores, whether their traffic is growing or declining, where their visitors come from, what demographics they attract, and how their performance compares to yours in every shared market. You can see this weekly, for any brand, without them knowing you are looking.
In a category where PassBy’s data shows a 30+ percentage point gap between the best-performing brand (Coach, +20.14% same-store traffic) and the worst (Tommy Hilfiger, -10.43%), understanding what competitors are doing differently is not optional. It is the difference between expanding into the right markets and retreating from the wrong ones.
What apparel competitive intelligence looks like with data
Traditional competitive intelligence in fashion focuses on product, pricing, and positioning. Those matter. But foot traffic data answers a different set of questions that are harder to get at through traditional methods:
Are competitors gaining or losing physical store traffic? Quarterly earnings reports tell you about revenue. Foot traffic data tells you about demand before it converts to revenue. A competitor whose traffic is declining but whose revenue is holding may be masking problems with higher average transaction values or price increases. That is a fragile position.
Where are competitors performing best and worst? A national brand performs differently in every market. Foot traffic data reveals which specific markets a competitor is strong in (and therefore harder to challenge) and which markets they are weak in (and therefore more vulnerable). This shapes your expansion and marketing investment decisions at the market level.
Who is visiting competitor stores? Demographic and psychographic data on competitor visitors reveals whether their customer base overlaps with yours or is distinct. High overlap means you are fighting for the same customers. Low overlap means you serve different segments and may not be direct competitors despite operating in the same category.
What is happening in real time? A competitor opens a new store, launches a campaign, or refreshes a location. Foot traffic data shows whether those moves are working within weeks, not quarters.
How to set up competitive benchmarking in Almanac
PassBy’s Almanac platform is built for exactly this kind of analysis. Here is how apparel teams use it for competitive intelligence.
Building a competitive set
The first step is defining who you are benchmarking against. In Almanac, you can compare up to five brands simultaneously in a benchmarking report. For an apparel brand, the competitive set typically includes:
Direct competitors in the same segment and price point. A premium activewear brand benchmarks against Lululemon, Alo Yoga, Vuori, and Athleta. A mid-market casualwear brand benchmarks against Gap, J.Crew, Uniqlo, and H&M.
Aspirational competitors that represent the trajectory you want. If you are a growing DTC brand, benchmarking against a brand two stages ahead (more stores, higher traffic) shows what success looks like and reveals the traffic patterns you should be tracking toward.
Adjacent competitors in related categories that compete for the same consumer’s wallet share. An apparel brand may lose traffic not to another apparel brand but to an experiential category (dining, wellness, entertainment) that captures the same consumer’s discretionary spend.
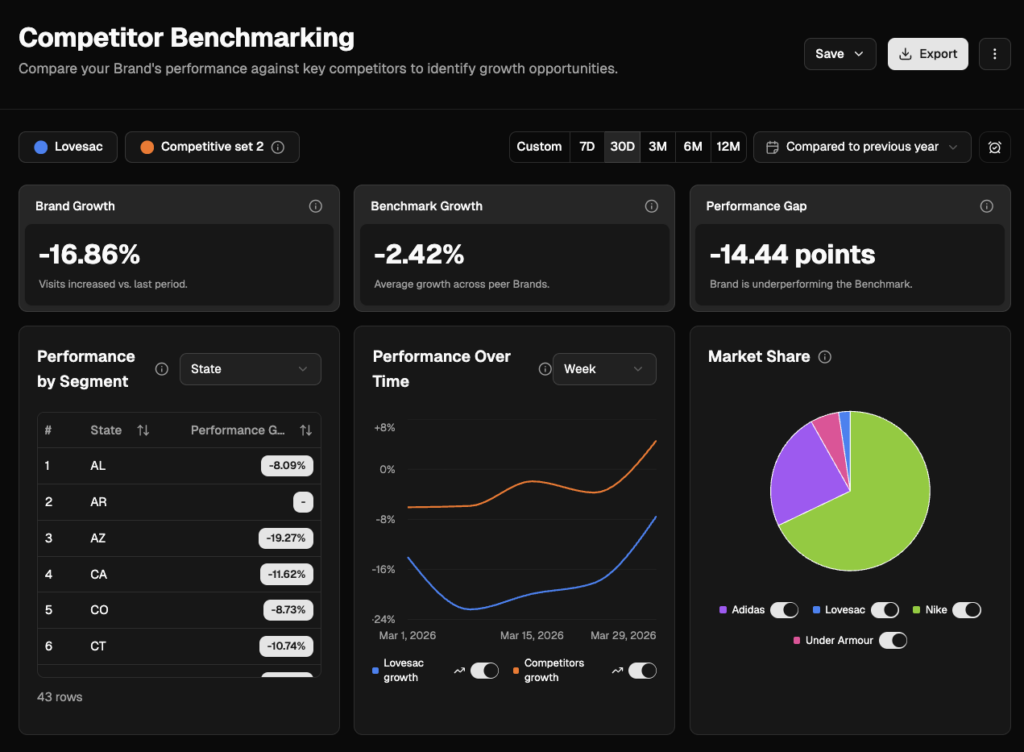
To build a benchmarking report in Almanac: log in, select “Benchmarking Report,” choose your brand and up to four competitors, set the date range, and load the report. For a step-by-step guide, see the Almanac help centre.
The metrics that matter for apparel CI
Not every metric matters equally. For apparel competitive intelligence, these are the ones that drive decisions:
Same-store traffic YoY. This is the cleanest measure of competitive momentum. It controls for store count changes and shows whether existing locations are gaining or losing visitors. PassBy’s data shows the full range: Coach at +20.14%, PacSun at +7.10%, and Fabletics at +5.16% on the growth side. PUMA at -9.85%, Bonobos at -9.88%, and Tommy Hilfiger at -10.43% on the decline side. Knowing where your competitors sit on this spectrum tells you whether you are gaining or losing ground.
Traffic share within a market. In any given trade area, how much of the total apparel foot traffic goes to each brand? If you have 12% traffic share in a market and a competitor has 25%, you know who the consumer defaults to. If your share is growing and theirs is shrinking, the momentum is on your side. Almanac’s market view shows this at the centre, cluster, and trade area level.
Visitor demographics. Understanding the age, income, and lifestyle profile of your competitors’ visitors reveals whether you are competing for the same consumer or adjacent ones. If a competitor’s visitor base skews 10 years older and 30% higher income than yours, you are not truly competing, even if you sell similar products. This insight prevents wasted competitive effort and redirects it toward your actual rivals.
Cross-visitation patterns. What other brands do your visitors (and your competitors’ visitors) also visit? Cross-visitation data reveals which brands share customers and which serve distinct audiences. A brand discovering that 35% of its visitors also visit a specific competitor has a different competitive challenge than one discovering only 5% overlap.
Visit frequency and recency. How often do competitors’ customers return, and how recently have they visited? A competitor with high frequency has strong loyalty. One with declining recency may be losing habitual shoppers. These signals are not available from any other data source.
Market-level competitive analysis
Almanac’s Markets view analyses retail environments (malls, centres, clusters, trade areas) as competitive arenas. For apparel, this means you can see:
How your brand performs in a specific mall relative to other apparel tenants in that mall. If you are the third-most-visited apparel brand in a centre where you are paying second-highest rent, that is a negotiation data point.
Which markets have the highest concentration of your target competitors and the lowest presence of your brand, signalling expansion opportunities.
Whether a competitor is performing better or worse in a specific market than their national average, suggesting local factors (co-tenancy, demographic fit, marketing investment) that you can learn from or exploit.
Apparel-specific competitive scenarios
Scenario 1: DTC brand evaluating expansion markets
A growing DTC apparel brand with 30 stores wants to identify the next 10 markets to enter. Competitive intelligence informs this by revealing which markets have strong demand for their category (high traffic to similar brands) but limited supply (no direct competitor presence or a weak competitor losing traffic).
In Almanac, the brand builds a benchmarking report comparing itself against three aspirational competitors across the top 50 US metros. Markets where the aspirational competitors are growing but the brand has no presence represent the highest-priority targets. Markets where competitors are declining may signal category-level headwinds rather than opportunities.
Scenario 2: Mall-based retailer negotiating a lease renewal
A specialty apparel retailer in a super-regional mall is facing a rent increase at lease renewal. PassBy’s data shows that the mall’s overall traffic declined 1.2% YoY and the retailer’s own traffic declined further. The competitive benchmarking shows that two other apparel tenants in the same mall are also declining, while the mall’s non-apparel tenants (dining, entertainment) are growing.
Armed with this data, the retailer enters the negotiation with evidence that the rent increase is not justified by the traffic environment. The data also informs whether to renew at all: if the mall’s traffic trajectory is negative and the competitive set is weakening, relocation to a community centre (format growing 1.22% YoY) may be the better strategic move.
Scenario 3: Monitoring a competitor’s new store launch
A competitor opens a flagship in a market where your brand already operates. Foot traffic data lets you track the new store’s ramp-up in real time: how quickly it reaches steady-state traffic, whether it is drawing visitors from your stores (cannibalisation) or from the broader market, and what visitor profile it attracts.
If the competitor’s new store is drawing 20% of its visitors from your trade area, that quantifies the impact and triggers a response: marketing investment, store refresh, or promotional activity in that market. If the store draws visitors from outside your trade area, the competitive impact is lower and the response can be proportional.
Scenario 4: Identifying a competitor’s weakness
PassBy’s data shows a competitor’s same-store traffic declining 8% in a market where the apparel category is flat. Something specific to that brand is underperforming. By examining the competitor’s visitor demographics (has their customer profile shifted?), cross-visitation (are their customers going elsewhere?), and trade area dynamics (has the surrounding population changed?), you can diagnose the cause.
If the diagnosis suggests the competitor’s customer base is migrating toward your brand’s positioning (younger, more premium, more digitally engaged), that validates further investment in the market. If the diagnosis suggests a market-level shift toward off-price (customers trading down), the response is different.
Competitive intelligence as an ongoing discipline
The apparel brands that extract the most value from competitive intelligence treat it as a recurring practice, not a one-off project. A monthly cadence works for most teams:
Weekly during key periods. Monitor competitive traffic during back-to-school (August), holiday (November-December), and any period when a competitor launches a new store or major campaign in your market.
Monthly for portfolio review. Review the benchmarking dashboard across your competitive set. Flag any brand whose traffic trend has changed direction (a competitor that was growing and is now declining, or vice versa). Investigate the cause.
Quarterly for strategic planning. Use the accumulated competitive data to inform expansion decisions, lease negotiations, marketing budget allocation, and merchandising strategy. Share the competitive report with real estate, marketing, and merchandising teams so every function operates from the same competitive picture.
PassBy offers a Test & Learn tier with 90 days of Almanac access, enough time to build your competitive set, run benchmarks across your key markets, and establish a baseline for ongoing monitoring. See pricing →
For a walkthrough of setting up competitive benchmarking in Almanac, visit the help centre or book a demo →.
FAQ
What is competitive intelligence in apparel retail?
Competitive intelligence in apparel is the systematic collection and analysis of data on competitor performance, positioning, and market activity. With foot traffic data, this extends beyond traditional methods (store visits, earnings reports, product tracking) to include quantitative measurement of competitor store traffic, visitor demographics, market share, and real-time performance monitoring.
How do apparel brands benchmark against competitors?
In Almanac, apparel brands build benchmarking reports comparing up to five brands simultaneously across any date range. The key metrics are same-store traffic YoY, traffic share within a market, visitor demographics, cross-visitation patterns, and visit frequency. These reveal whether competitors are gaining or losing ground, and where. See the help centre for a setup walkthrough.
Which apparel brands are gaining the most foot traffic?
According to PassBy data, Coach (+20.14%), Akira (+12.03%), Sperry (+9.74%), Grunt Style (+8.91%), Eddie Bauer (+8.67%), PacSun (+7.10%), and J. Crew Factory (+6.69%) are among the strongest same-store traffic gainers. The common thread is clear brand identity and a value proposition that justifies the physical visit. See apparel foot traffic data for the full breakdown.
Which apparel brands are losing the most foot traffic?
Tommy Hilfiger (-10.43%), Casual Male XL (-10.20%), Bergdorf Goodman (-10.14%), Bonobos (-9.88%), PUMA (-9.85%), SuitSupply (-9.82%), and FILA (-9.60%) saw the sharpest same-store traffic declines. The causes vary by brand but include brand momentum challenges, format headwinds, and digital channel migration.
How often should apparel brands review competitive benchmarks?
Monthly is the minimum cadence for ongoing competitive monitoring. Weekly monitoring is warranted during specific periods: when a competitor opens a new store in your market, during key seasonal windows (back-to-school, holiday), or when you are making expansion or lease decisions that require current competitive data.
Can foot traffic data show if a competitor’s new campaign is working?
Yes. By monitoring a competitor’s weekly traffic before, during, and after a campaign launch, you can see whether the campaign drove a measurable traffic lift. If a competitor runs a regional marketing blitz and their store traffic spikes 15% while yours remains flat, that quantifies the competitive impact and informs your response.