

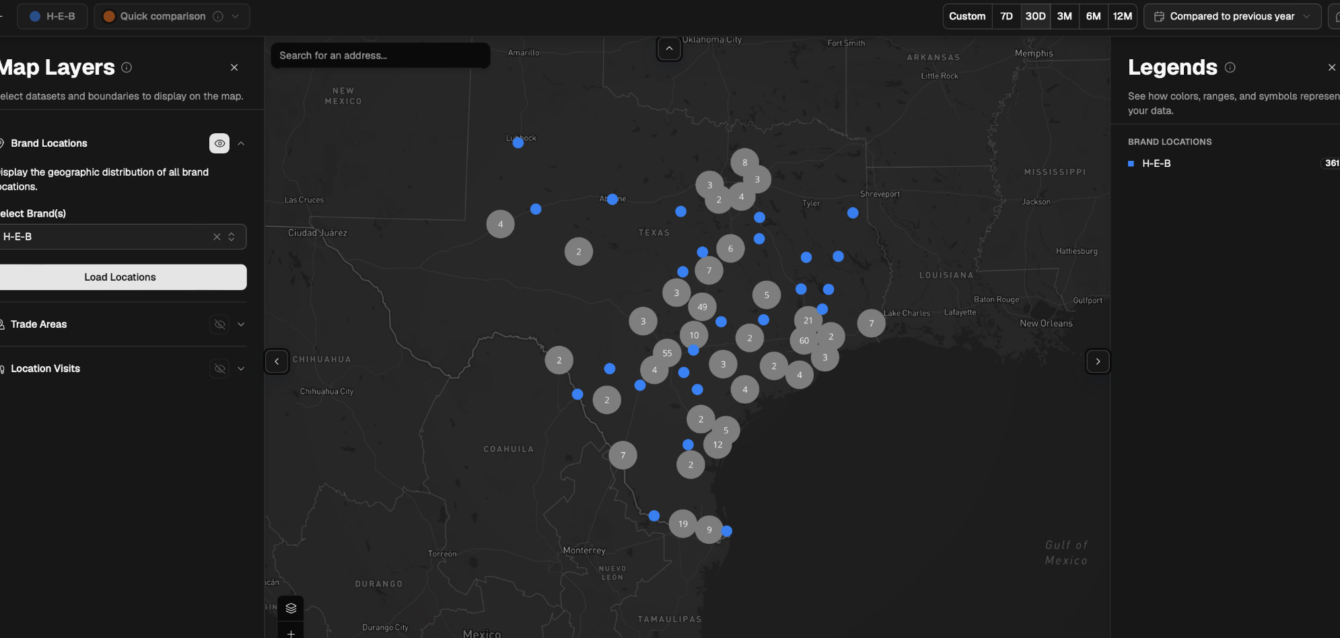
When making a competitor traffic report, getting into the specifics about how your competitor’s stores are performing is crucial. Our location type filters are there to help you analyze mall, non-mall, community, and other store types in detail.
To track competitor performance across location type, follow these steps:
- Login to Almanac and click “Brands” in the sidebar and select the brand you want to analyze
- Select the filter drop down menu and select “Apply filter”
- Click “Retail area type” and select the type(s) you’d prefer
- Customize your dashboard view for your analysis
- Save, export and share the report to your team
Let’s go into each of those steps in more detail to guide you through the process.
1. Login to Almanac and click “Brands” in the sidebar and select the brand you want to analyze
You will need an Almanac account to begin. If you don’t already have an account, book a 15 minute walkthrough with our team.
2. Select the filter drop down menu and select “Apply filter”

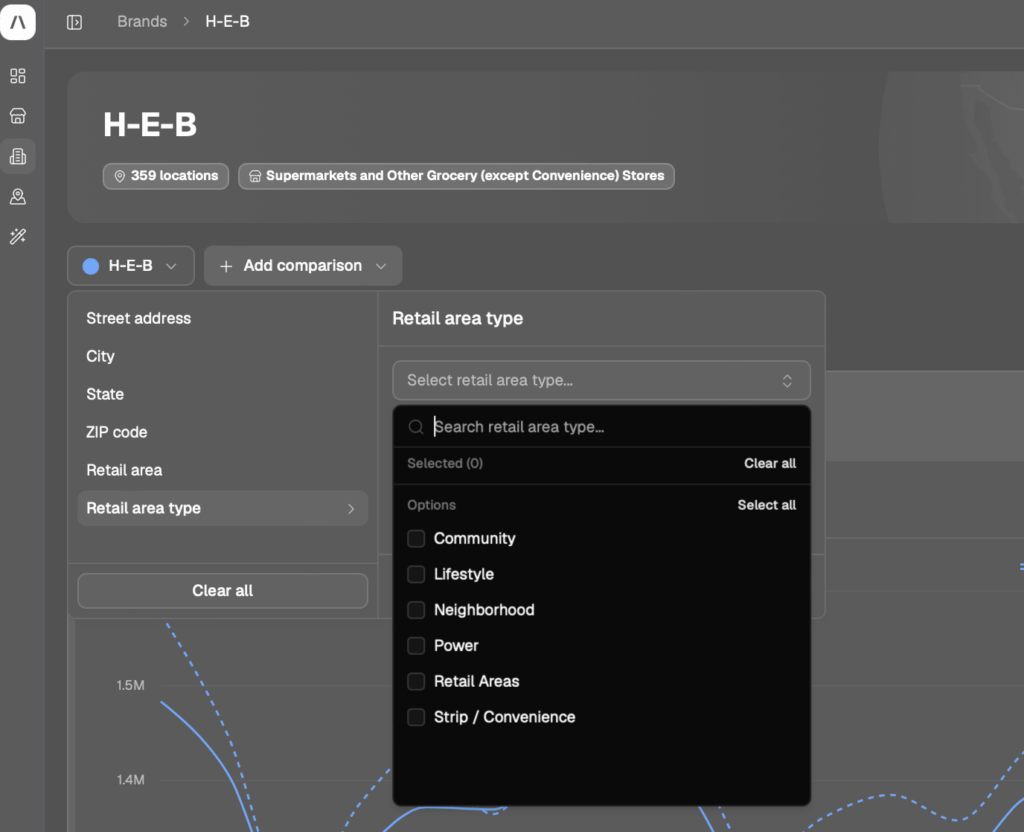
3. Click “Retail area type” and select the type(s) you’d prefer to analyze.
These filters are:
- Community:
- Lifestyle:
- Neighborhood:
- Power:
- Retail areas: Non-mall locations, such as downtown areas, streets and retail corridors.
- Strip / convenience:
We’ll be choosing “Retail areas” in this example. You can select just one filter or multiple.
4. Customize your dashboard view for your analysis
By selecting the filter(s) of location types, you should now see a graph of foot traffic performance for those retail locations.
From here, you can:
- Adjust your time change
- Add a comparison window
- Switch from a line graph to a bar chart
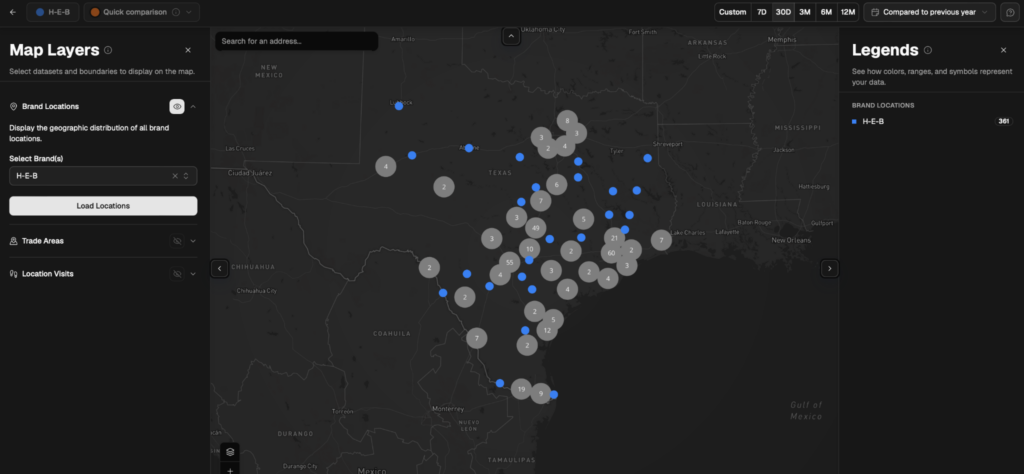
- Select Map View
All of these options are there to aid your analysis. See our help center or contact your account manager if you have any further questions on how to use the dashboard.
5. Save, export and share the report to your team
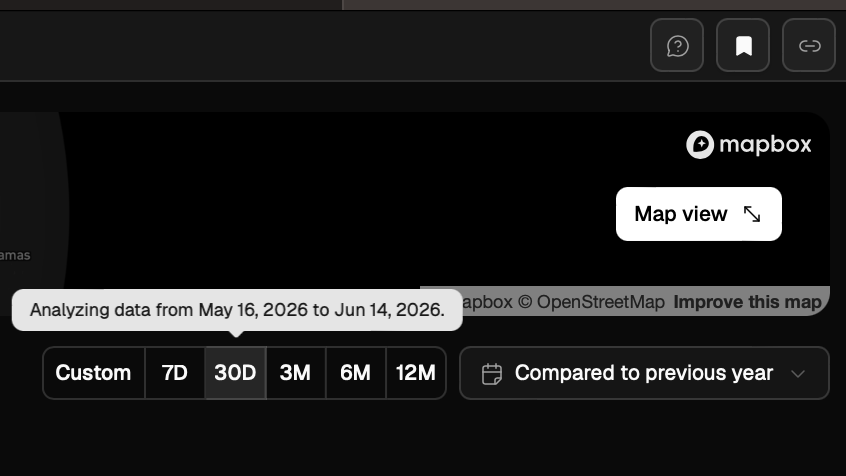
So, you’ve got your dashboard all ready, but how can you save it? In the top right of the screen, you’ll see a bookmark icon. Save this to keep the report in the sidebar so you can revisit it later.
Next to the save button you’ll find the shareable link icon. Click and copy the link to share a direct link to the report you’ve created.
You can also save the filter set you’ve made to keep it ready and include it in other reports. To save the filter set, go back to the brand drop down and select “save filter”.
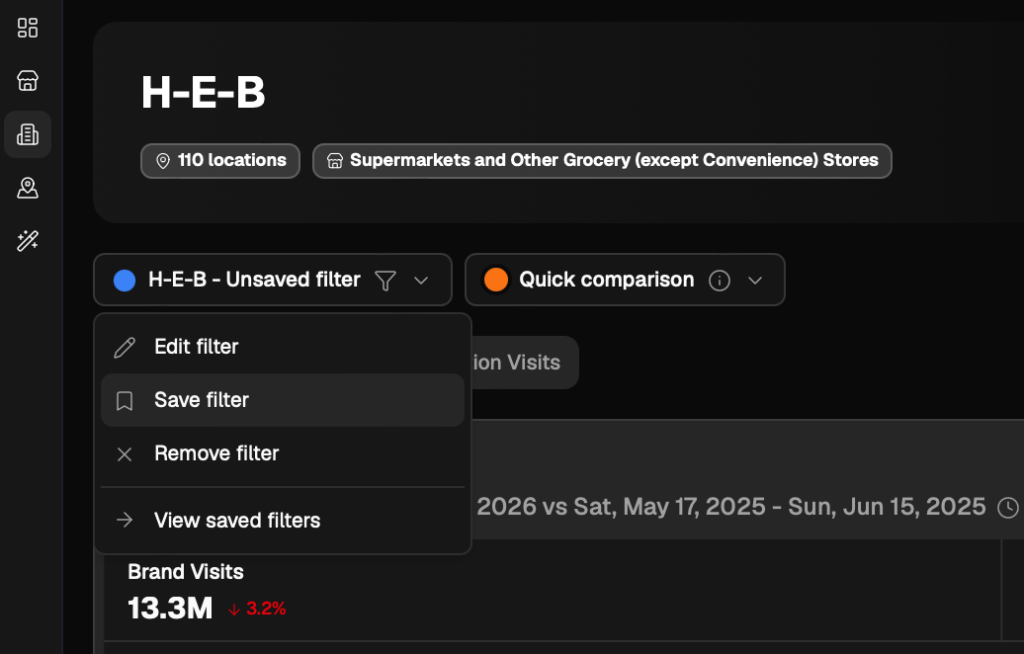
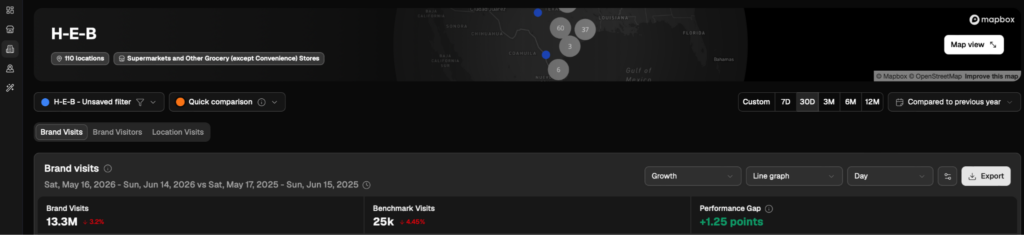
To export your report, click the “export” button above the graph. This will download the data as a CSV file.
Track competitor performance with PassBy’s Almanac platform
Ready to start tracking competitor performance across location type? Sign up for an Almanac account today to unlock powerful insights.
If you are already an Almanac user, connect your account to ChatGPT or Co-Pilot to get fast answers to questions about your competitors.
FAQs
Do I need an Almanac account?
Yes, to complete an analysis of competitor performance across location types you will need an Almanac account. You can sign up for the Almanac platform here. Current users simply need to login and follow the steps above.
Can I track competitor performance on mobile?
Yes, by using PassBy’s AI integrations on mobile devices via the official ChatGPT app on iOS and Android. It’s perfect for getting a quick pulse check on the go. For in-depth and continuous tracking of competitor performance, narrowed down by location type for granular data, use the Almanac platform.