

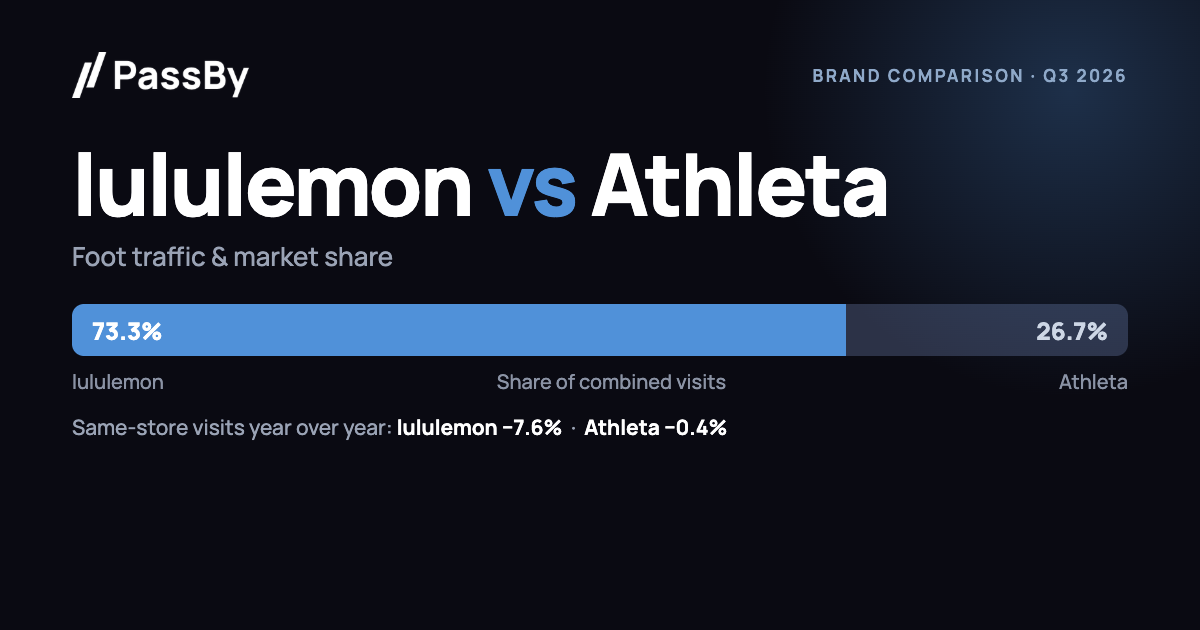
Athleta gained ground on lululemon in Q3 2026. Same-store visits at lululemon fell 7.6% year over year, compared with a decline of 0.4% at Athleta. lululemon’s share of combined visits fell from 76.1% to 73.3% (−2.8 points). lululemon operated fewer locations (−11.4%) while Athleta shrank by 5.1%.
−7.6% lululemon same-store visits YoY |
−0.4% Athleta same-store visits YoY |
73.3% lululemon share of combined visits |
−2.8 lululemon share change (pts) |
Which gets more visits, lululemon or Athleta?
In Q3 2026, lululemon accounted for 73.3% of combined visits to the two chains and Athleta for 26.7%. PassBy recorded visits at 489 lululemon locations and 243 Athleta locations; lululemon’s count fell 11.4% and Athleta’s fell 5.1% over the year.
| Q3 2026 | lululemon | Athleta |
|---|---|---|
| Same-store visit growth (YoY) | −7.6% | −0.4% |
| Share of combined visits | 73.3% | 26.7% |
| Locations with recorded visits | 489 | 243 |
| Change in locations vs Q3 2025 | −11.4% | −5.1% |
Is Athleta gaining market share from lululemon?
Athleta has taken share. lululemon’s portion of combined visits fell from 76.1% in Q3 2025 to 73.3% in Q3 2026, a shift of 2.8 points. lululemon’s share rose in 3 of the last 8 quarter-to-quarter comparisons.
Share of combined visits across all locations with recorded visits. Because both brands are measured over the same days, share is not distorted by seasonality.
Where does each brand lead?
Across the 7 states where both chains have at least 10 locations, lululemon drew the larger share of visits in all 7. Athleta gained the most in California.
| State | lululemon share | Athleta share | lululemon change vs last year | Leader |
|---|---|---|---|---|
| California | 77.8% | 22.2% | −1.1 pts | lululemon |
| Texas | 80.0% | 20.0% | −1.3 pts | lululemon |
| New York | 72.4% | 27.6% | −3.0 pts | lululemon |
| Illinois | 67.3% | 32.7% | −0.8 pts | lululemon |
| Virginia | 62.7% | 37.3% | −1.2 pts | lululemon |
| New Jersey | 65.9% | 34.1% | −3.9 pts | lululemon |
| Pennsylvania | 58.3% | 41.7% | −0.7 pts | lululemon |
Ten largest states by combined visits. Same-store locations only.
Frequently asked questions
Which gets more visits, lululemon or Athleta?
In Q3 2026, lululemon drew 73.3% of combined visits to the two chains, from 489 locations against 243 for Athleta.
Is Athleta gaining market share from lululemon?
Yes. Athleta’s share of combined visits rose by 2.8 points between Q3 2025 and Q3 2026.
Is lululemon foot traffic up or down in 2026?
Down. Same-store visits at lululemon fell 7.6% in Q3 2026 compared with the same weeks of 2025.
Is Athleta foot traffic up or down in 2026?
Down. Same-store visits at Athleta fell 0.4% in Q3 2026 compared with the same weeks of 2025.
Which has more locations, lululemon or Athleta?
PassBy recorded visits at 489 lululemon locations and 243 Athleta locations in Q3 2026.
Where does lululemon lead Athleta?
lululemon drew the larger share of visits in 7 of the 7 states where both chains have at least 10 locations, including California, Texas and New York.
How we measured this
Figures come from PassBy’s foot traffic panel of store-level visits. Same-store growth compares Q3 2026 (Jul 1, 2026 – Sep 30, 2026) with the same weeks a year earlier (Jul 2, 2025 – Oct 1, 2025), shifted 364 days so weekdays line up, and only counts locations with recorded visits in both periods (481 lululemon and 241 Athleta locations). Share of combined visits uses all locations with recorded visits in each quarter, so it reflects openings and closures. Brand figures cover locations operating under the named banner only (for example, not sister banners owned by the same parent company). Visit counts are panel estimates, so we report growth, share and ratios rather than raw totals. Updated quarterly.
Want this comparison for your brand? PassBy tracks foot traffic, market share and trade areas for thousands of US retail and restaurant chains. Talk to our team.