


Welcome to the ultimate guide on America’s most popular fast food chains and foot traffic data to prove it. Ever wondered if there are really more Subways than McDonald’s in the U.S.? We’ve got the insights and data to quench that curiosity. Dive in as we explore foot traffic data, the number of locations, and find out which chain reigns supreme.
Jump to:
At pass_by, we offer the highest in market accuracy with 94% correlation to ground truth, over 15 data inputs, and a full 90 days of predictive feeds. Book a call now.
Top fast food chains in the U.S
When you think about grabbing a quick bite, the lineup of top fast food chains in the US probably comes to mind. These brands have not only become household names but have also dominated the fast-food landscape through strategic placements, catchy advertising, and, of course, delicious offerings.
- By U.S revenue, McDonald’s is the top fast food chain with over $10.38 billion generated in 2023.
- By number of U.S chains, Subway is the top fast food chain in the U.S with over 19,000 chains.
- By customer satisfaction, Chick-fil-A is the top fast food chain with a rating of 83% in 2024.
- By average number of visits per chain, Burger King is the number one fast food chain with an average of 61,912 visits per store in June 2024.
The top fast food chains, making waves with their food and huge foot traffic numbers include:
- McDonald’s
- Subway
- Taco Bell
- Burger King
- Wendy’s
- KFC
- Starbucks
- Chick-fil-A
We’ll take a deeper look into each chain and explore their foot traffic data.
At pass_by, we offer the highest in market accuracy with 94% correlation to ground truth, over 15 data inputs, and a full 90 days of predictive feeds. Book a call now.
McDonald’s
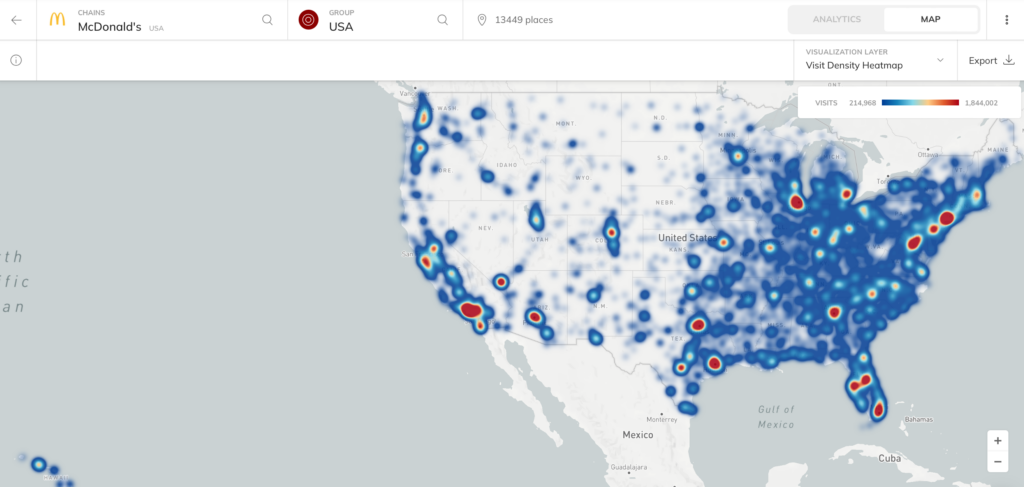
- Number of U.S chains: 13,452
- Number of chains worldwide: 40,275
- 2023 Global revenue: $25.49 billion
- 2023 U.S revenue: $10.38 billion
- U.S average store visits: 2,079 daily
- Customer satisfaction rating: 71%
McDonald’s foot traffic data
- 827.2M visits in June 2024
- Average visits per store 61,510
- U.S average store visits: 2,050 daily
- Visits June 2024 vs May 2024: -6.80%
- Visits June 2023 v June 2024: -9.58%
Subway
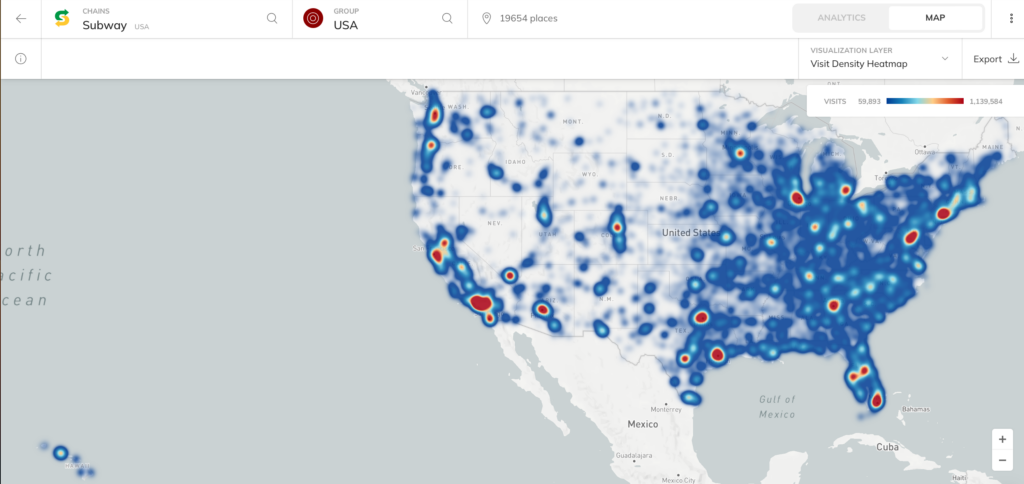
- Number of U.S chains: 19,573
- Number of chains worldwide: 37,000+
- 2023 Global revenue: $16.1 billion
- 2022 U.S revenue: $10.37 billion
- Customer satisfaction rating: 74%
Subway foot traffic data
- 625.6M visits in June 2024
- Average visits per store 31,830
- U.S average store visits: 1,061 daily
- Visits June 2024 vs May 2024: -5.87%
- Visits June 2023 v June 2024: -9.30%
Taco Bell
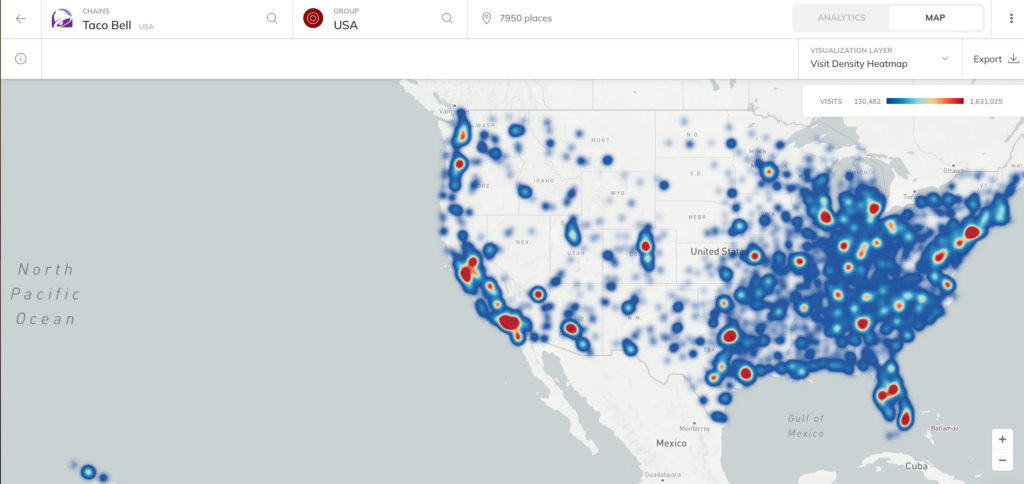
- Number of U.S chains: 7,877
- Number of chains worldwide: 8,564
- 2023 Global revenue: $2.437 billion
- Customer satisfaction rating: 73%
Taco Bell foot traffic data
- 444.4M visits in June 2024
- Average visits per store 55,897
- U.S average store visits: 1,863 daily
- Visits June 2024 vs May 2024: -7.00%
- Visits June 2023 v June 2024: -9.38%
Burger King
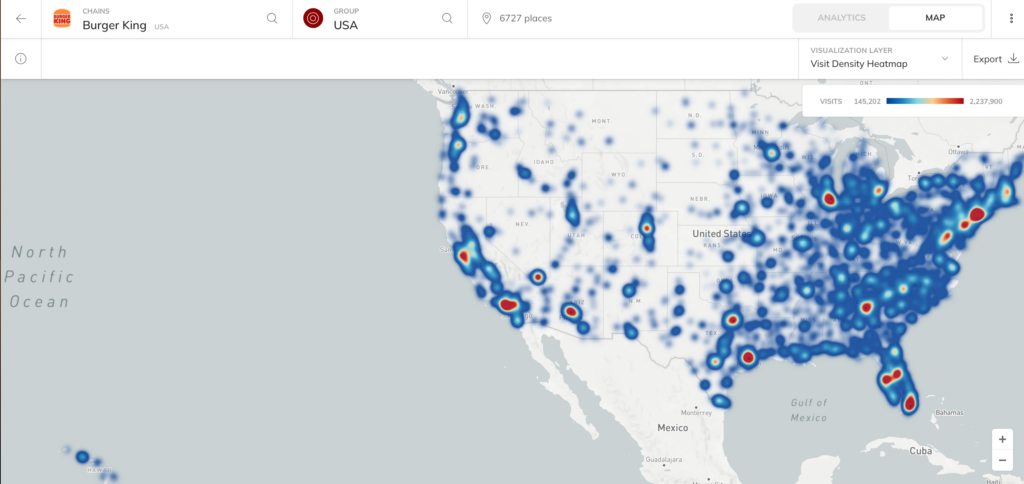
- Number of U.S chains: 6,727
- Number of chains worldwide:
- 2023 Global revenue: $1.3 billion
- Customer satisfaction rating: 77%
Burger King foot traffic data
- 416.5M visits in June 2024
- Average visits per store 61,912
- U.S average store visits: 2,064 daily
- Visits June 2024 vs May 2024: -7.02%
- Visits June 2023 v June 2024: -10.99%
Wendy’s
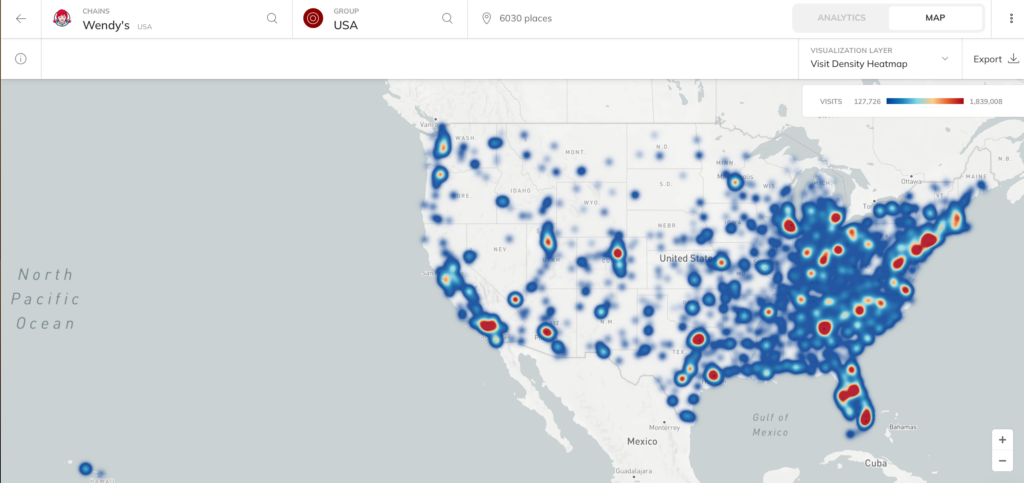
- Number of U.S chains: 6,032
- Number of chains worldwide: 7,240
- 2023 Global revenue: $2.18 billion
- Customer satisfaction rating: 76%
Wendy’s foot traffic data
- 352M visits in June 2024
- Average visits per store 58,379
- U.S average store visits: 1,946 daily
- Visits June 2024 vs May 2024: -8.36%
- Visits June 2023 v June 2024: -6.08%
KFC
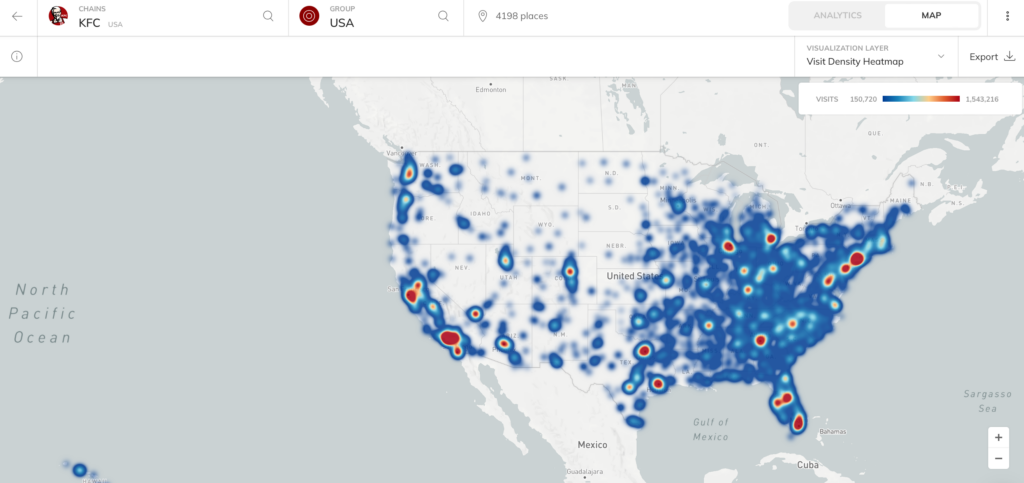
- Number of U.S chains: 4,263
- Number of chains worldwide: 29,000
- 2023 global revenue: $2.83 billion
- Customer satisfaction rating: 81%
KFC foot traffic data
- 228.7M visits in June 2024
- Average visits per store 54,481
- U.S average store visits: 1,816 daily
- Visits June 2024 vs May 2024: -6.33%
- Visits June 2023 v June 2024: -2.94%
Starbucks
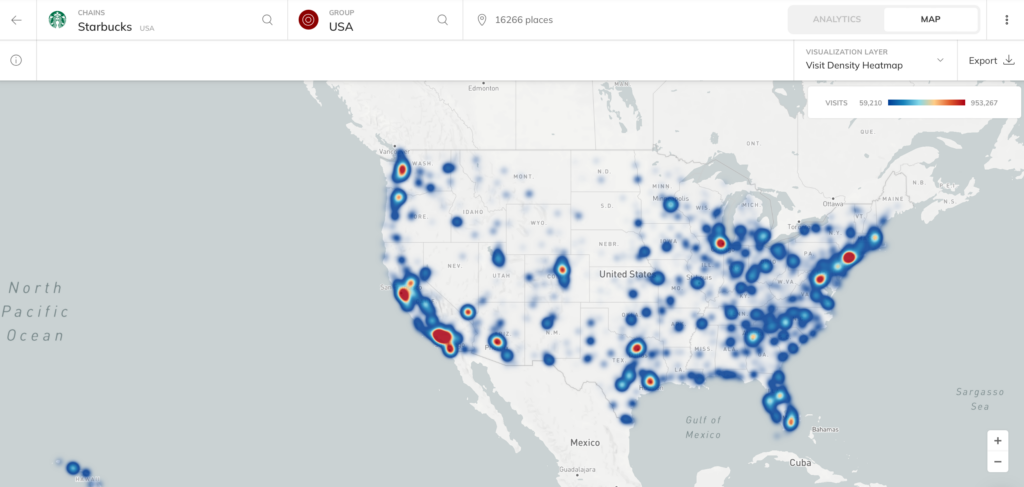
- Number of U.S chains: 17,068
- Number of chains worldwide: 32,000
- 2023 Global revenue: $29.46 billion
- Customer satisfaction rating: 80%
Starbucks foot traffic data
- 451.9M visits in June 2024
- Average visits per store 27,782
- U.S average store visits: 926 daily
- Visits June 2024 vs May 2024: -3.09%
- Visits June 2023 v June 2024: -4.57%
Chick-fil-A
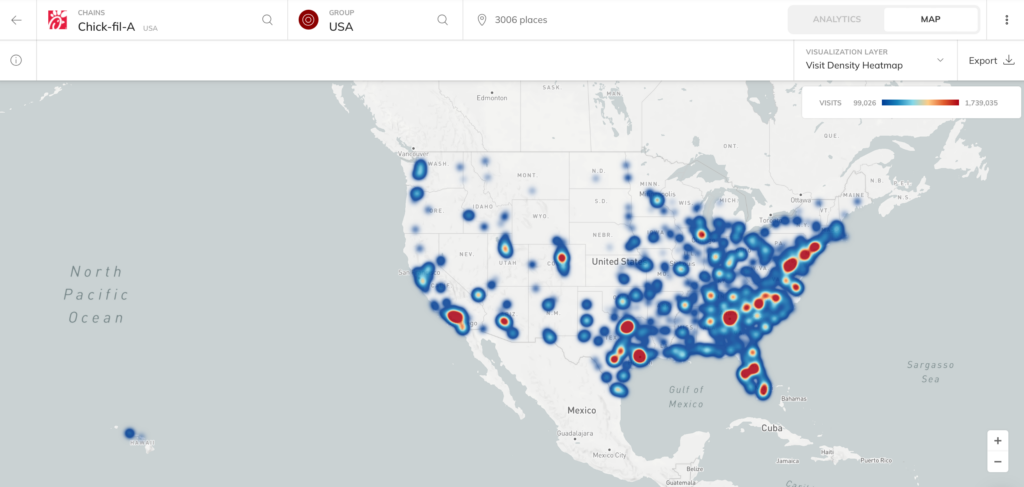
- Number of chains*: 3,059
- 2023 Global revenue: $7.8 billion
- Customer satisfaction rating: 83%
*including District of Columbia and Puerto Rico
Chick-fil-A foot traffic data
- 151.1M visits in June 2024
- Average visits per store: 50,253
- U.S average store visits: 1,675 daily
- Visits June 2024 vs May 2024: -6.64%
- Visits June 2023 v June 2024: -12.12%
At pass_by, we offer the highest in market accuracy with 94% correlation to ground truth, over 15 data inputs, and a full 90 days of predictive feeds. Book a call now.
Are there more Subways than McDonalds?
This might come as a surprise, but Subway has more locations in the USA than McDonalds. Subway has a total of 19,573 locations in the USA as of May 2024. McDonald’s has 13,452 locations in the USA.
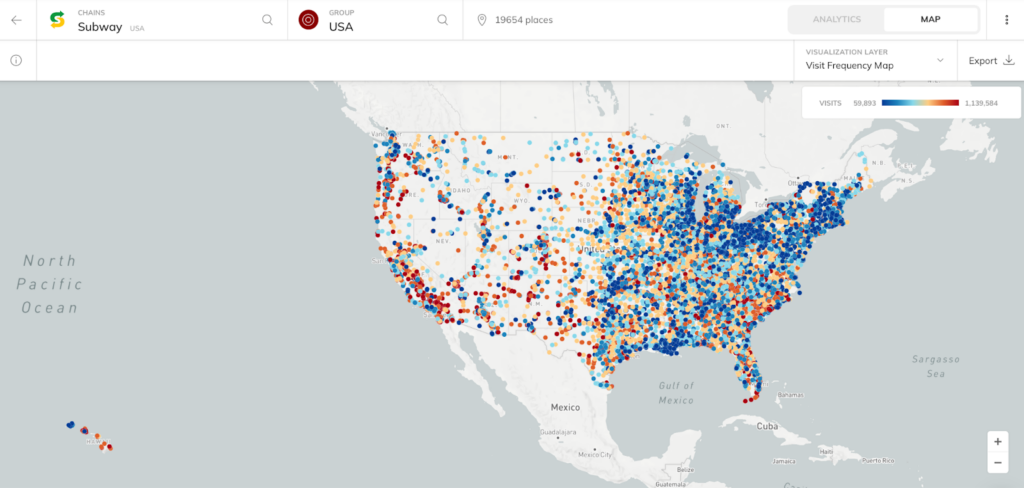
Both fast food chains have stores in all 54 states. However, Subway is present in 6,220 cities, that’s 1,175 more cities than McDonald’s.
Both chains have the most stores in the state of California. Subway has 2,116 chains while McDonald’s has 1,221 chains in California.
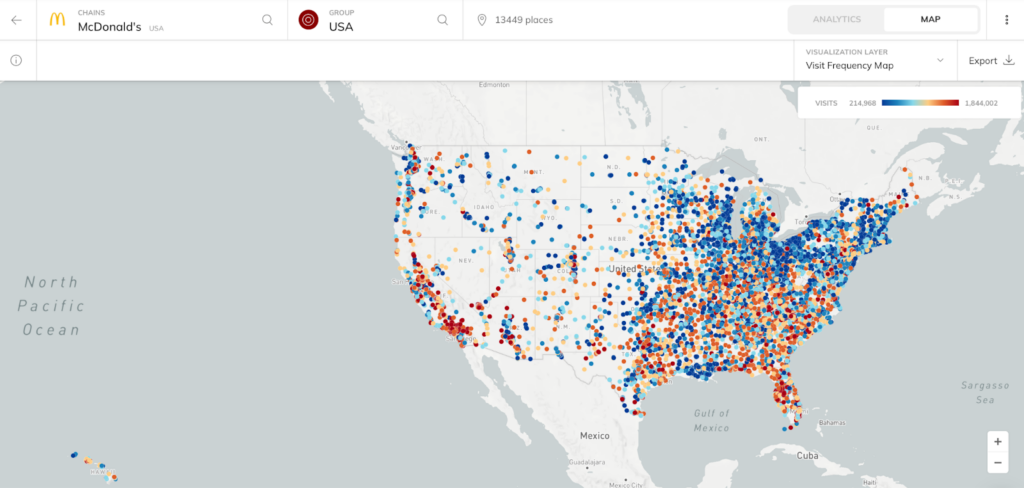
According to our data, McDonald’s had an average of 2,079 daily visits per store while Subway had 1,187 per store from January 2019 to June 2024.
Subway and McDonald’s also have similar average customer demographics. The average visitor of both chains is a high school graduate, earning $75,000 – $99,999 a year, and aged 45-49.
Read more: See our Retail Pulse report for more insights on top performing retailers.
Which fast food chain has the most locations worldwide?
The fast food chain with the most locations worldwide is McDonald’s. While it doesn’t have the most fast food chain locations in the U.S, it does have the highest number of total stores across the globe as it exists in more markets compared to its competitors.
McDonald’s has 13,452 locations in the USA. In 2023, McDonald’s had 41,822 locations around the world. The fast food chain plans to open 9,000 more by 2027.
In Europe, McDonald’s has many of its locations in France (over 1,500) and the United Kingdom (1,439).
Why is Subway more widespread than McDonald’s
Subway has thousands of more chains than McDonald’s worldwide. The reason as to why this is goes to the root of how these business’s plan growth. Both companies use franchises, but to a different extent.
Every single Subway store is a franchise. This means the Subway company technically owns none of these chains and the Subway brand can grow faster, as the costs of setting up the store are cheaper.
McDonald’s owns roughly 20% of all of its chains (around 2,600) and the remaining number are franchises.
Opening a McDonald’s has higher fees. Franchise applicants need a minimum of $500,000 available in liquid assets and pay a $45,000 franchise fee. Those looking to launch a new McDonald’s franchise can expect to shell out between $1,314,500 and $2,306,500.
In comparison, the costs of initial investment for a Subway chain ranges fro $229,050 – $522,300.
Are there any other fast food chains with more locations than McDonald’s?
Globally, McDonald’s has the highest number of fast food chains (40,275). This is closely followed by Subway (36,999), Starbucks (36,170), Mixue Ice Cream & Tea (36,153).
In the U.S, McDonald’s takes third place. Subway has the most chains with over 19,000, Starbucks has over 16,000, while McDonald’s has over 13,000 chains.
Which fast food chain has the highest customer satisfaction in the US?
According to the American Customer Satisfaction Index 2024, Chick-fil-A has the highest customer satisfaction rating of 83, followed by KFC at 81, and Arby’s with 80.
How to analyze fast food chain foot traffic
As you’ve seen, America is home to a plethora of popular fast food chains, each reaching for the top rankings in their own ways. While McDonald’s remains at the top globally, Starbucks, Burger King, and Subway are all hot on its heels.
But this is just one part of the picture. Take a closer look at our foot traffic data, analyze individual stores, and compare historic performance. At pass_by, we offer the highest in market accuracy with 94% correlation to ground truth, over 15 data inputs, and a full 90 days of predictive feeds. Book a call now.